Embedded Finance Statistics: 2026 Report

Our analysts reviewed funding, headquarters, and founding data for nine embedded finance infrastructure providers, along with two published market forecasts covering 2021 through 2031, to understand how large the embedded finance market is and where its private funding has gone as of Q4 2026. This report covers the private market only: privately held providers and their venture funding, with no publicly traded companies.
Key Findings
- Bain & Company and Bain Capital estimated US embedded finance revenue for software platforms and infrastructure providers at $21 billion in 2021 and forecast $51 billion for 2026.
- Juniper Research forecasts global embedded finance revenue of $617 billion in 2031, up 279% from $162.6 billion in 2026.
- Nine private infrastructure providers in our coverage have raised $1.79 billion in total, with a median of $190 million per provider.
- Four providers of cards and accounts raised $910 million, 50.9% of that total, ahead of four open banking payment providers at $585 million (32.7%) and one investing provider at $292 million (16.3%).
Embedded finance means that a company outside the financial industry offers a financial product inside its own software, such as a payroll platform that gives its customers business accounts or a marketplace that pays sellers by card. A small group of infrastructure providers supplies the accounts, cards, payment connections, and investing tools underneath those products, and venture investors have funded them heavily. Market-size forecasts for the category are easy to find, but they cover different regions and count different kinds of revenue, which makes them hard to compare with the money the providers have raised.
In the following sections, we compare the two published revenue forecasts, funding by provider, funding by provider segment, and funding by the year each provider was founded.
Published Forecasts Put Embedded Finance Revenue at $51B in the US and $617B Worldwide
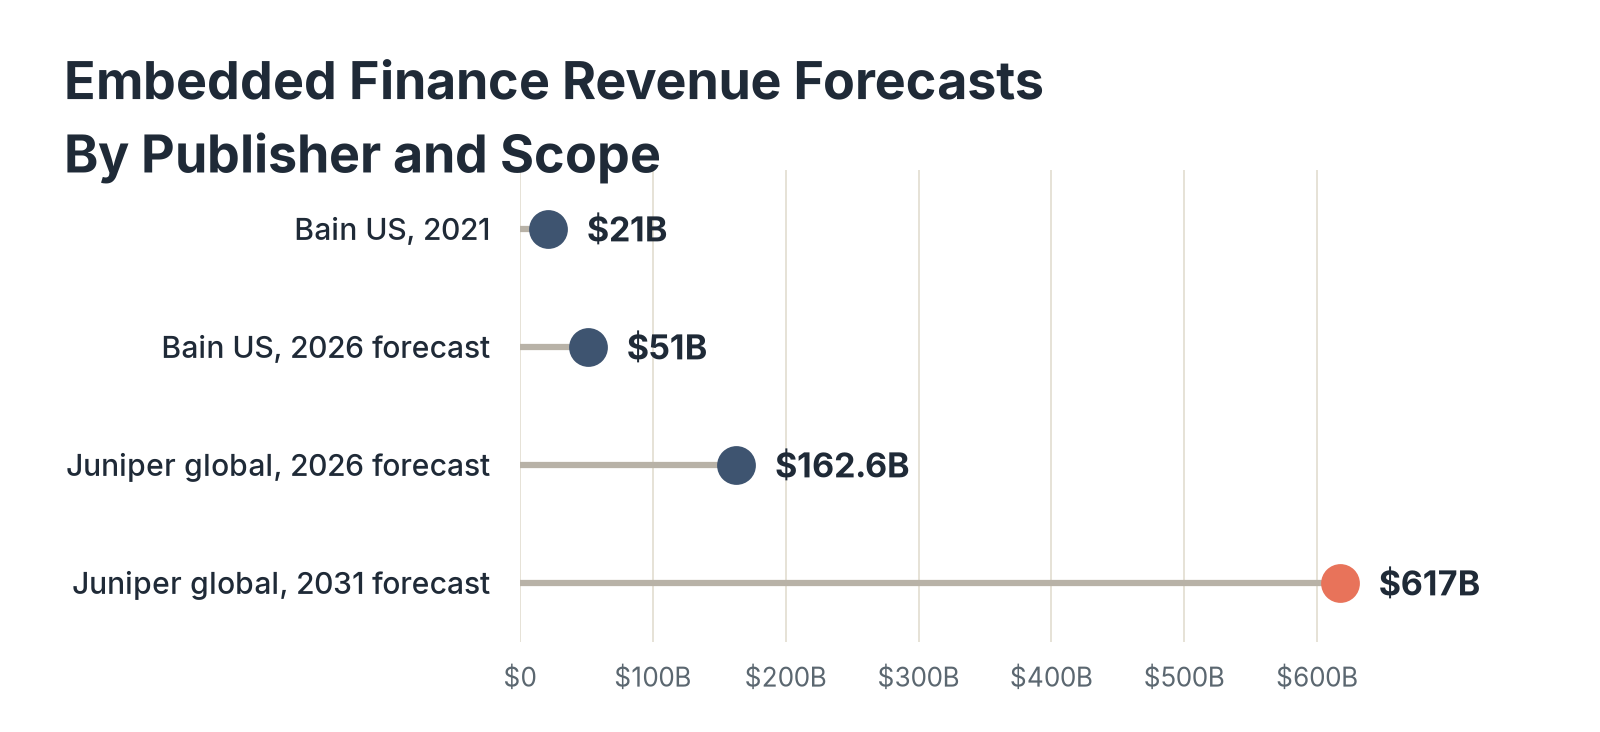
Anyone sizing the market meets two figures first: Bain & Company and Bain Capital's forecast for the United States and Juniper Research's forecast for the world. We placed the revenue figures from both in one table to show what each publisher measures and how far each expects revenue to grow.
| Publisher | Scope | Year | Revenue | Type |
|---|---|---|---|---|
| Bain & Company and Bain Capital | US software platforms and enabling infrastructure providers | 2021 | $21B | Estimate |
| Bain & Company and Bain Capital | US software platforms and enabling infrastructure providers | 2026 | $51B | Forecast |
| Juniper Research | Global embedded finance platform revenue | 2026 | $162.6B | Forecast |
| Juniper Research | Global embedded finance platform revenue | 2031 | $617B | Forecast |
Source: Fintech Index Embedded Finance Study (Source 1), from Bain & Company and Bain Capital (Source 2) and Juniper Research (Sources 3 and 4).
Data: embedded_finance_revenue_forecasts.csv
Key Findings
- Bain's 2026 forecast of $51 billion is 2.4 times its 2021 estimate of $21 billion, and Juniper's 2031 forecast of $617 billion is 3.8 times its 2026 figure.
- Bain measures US revenue and Juniper measures global revenue, so the chart places two different bases on one axis, and the two publishers' 2026 figures cannot be added or subtracted.
- Juniper expects business-to-business embedded finance to grow 390% from 2026 to 2031, the fastest of its segments.
Nine Private Providers Have Raised $1.79B, Led by Thredd and TrueLayer
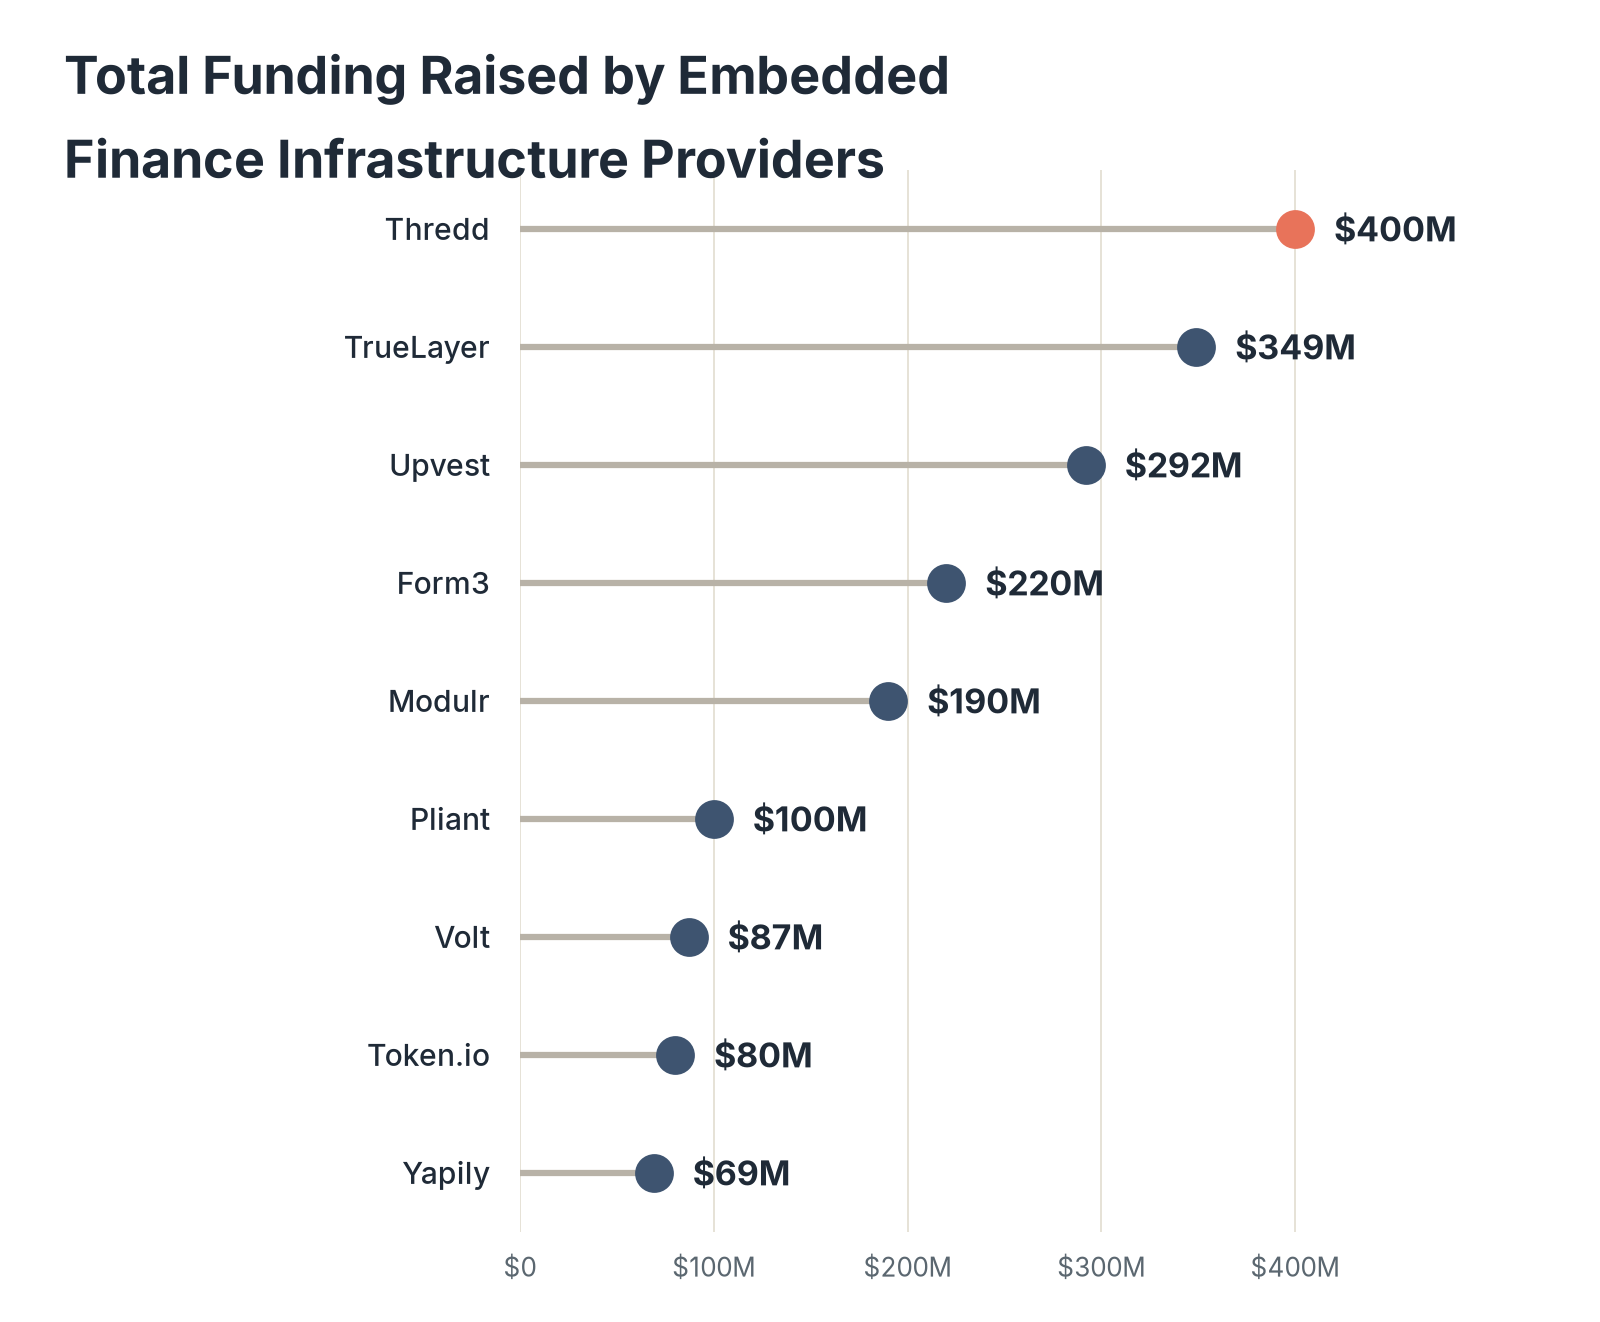
Revenue forecasts say how big the market may become, and funding shows how much investors have already put behind the companies building it. This section covers the nine infrastructure providers in our coverage for which we hold a total funding figure, along with where each is based, when it was founded, and its Fintech Index rating.
| Provider | Headquarters | Founded | Segment | Total funding | Fintech Index rating |
|---|---|---|---|---|---|
| Thredd | London, England | 2007 | Cards and accounts | $400M | 74 |
| TrueLayer | London, England | 2016 | Open banking payments | $349M | 74 |
| Upvest | Berlin, Germany | 2017 | Investing | $292M | 76 |
| Form3 | London, England | 2016 | Cards and accounts | $220M | 76 |
| Modulr | London, England | 2016 | Cards and accounts | $190M | 77 |
| Pliant | Berlin, Germany | 2020 | Cards and accounts | $100M | 75 |
| Volt | London, England | 2019 | Open banking payments | $87M | 73 |
| Token.io | London, England | 2016 | Open banking payments | $80M | 74 |
| Yapily | London, England | 2017 | Open banking payments | $69M | 74 |
Source: Fintech Index Embedded Finance Study (Source 1), from the Fintech Index review pages for each provider (Sources 5 to 13).
Data: provider_funding.csv
Key Findings
- Thredd raised the most at $400 million, which is 5.8 times the $69 million Yapily raised, the least of the nine.
- Seven of the nine providers are based in London and two in Berlin, and the median provider has raised $190 million.
- Fintech Index ratings range only from 73 to 77, and the highest-rated provider, Modulr at 77, is fifth by funding, while Thredd, the largest by funding, is rated 74.
Cards and Accounts Providers Hold Half of the Funding
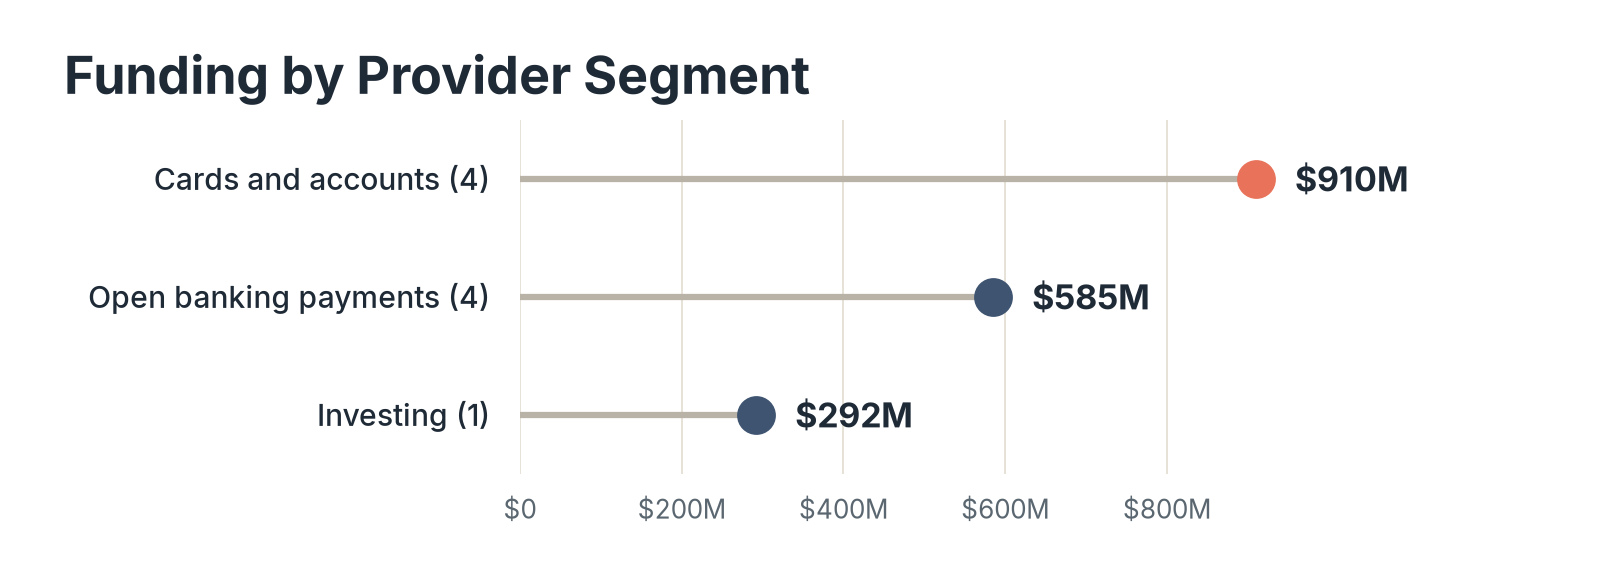
We grouped the nine providers by the product each sells to the companies that embed it, and totaled the funding for each group to see where the money has gone.
| Segment | Providers | Total funding | Share of total |
|---|---|---|---|
| Cards and accounts | 4 | $910M | 50.9% |
| Open banking payments | 4 | $585M | 32.7% |
| Investing | 1 | $292M | 16.3% |
| Total | 9 | $1,787M | 100.0% |
Source: Fintech Index Embedded Finance Study (Source 1), from the Fintech Index review pages for each provider (Sources 5 to 13).
Data: funding_by_segment.csv
Key Findings
- The four cards and accounts providers raised an average of $228 million each, compared with $146 million for each of the four open banking payment providers.
- Upvest, the only investing provider, raised $292 million, more than any open banking payment provider except TrueLayer at $349 million.
- TrueLayer accounts for 59.7% of open banking payment funding, and the other three providers in that segment raised $236 million combined.
Providers Founded in 2016 Raised Nearly Half of the Funding
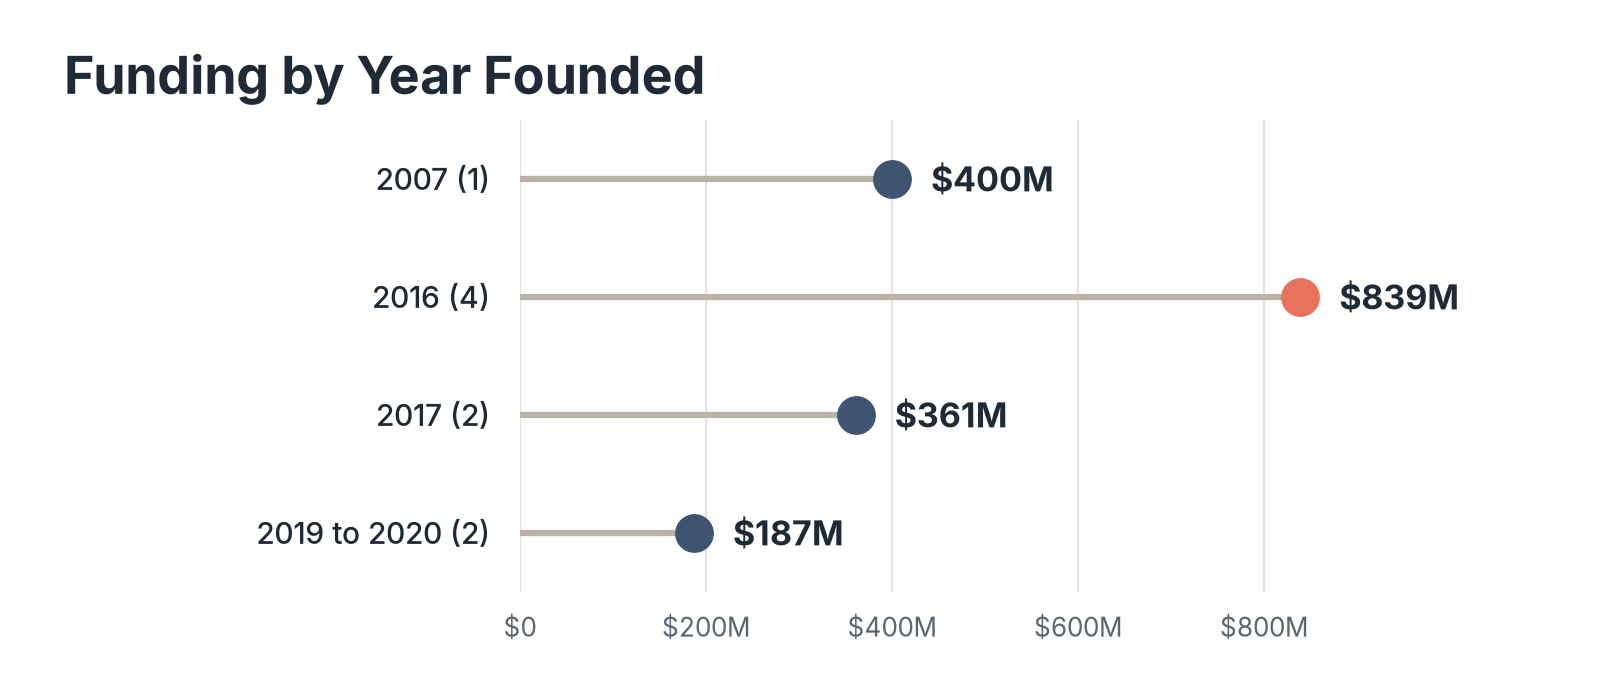
Funding depends partly on how long a provider has been raising money, so we also grouped the providers by the year each was founded, as stated on its review page.
| Year founded | Providers | Provider names | Total funding | Share of total |
|---|---|---|---|---|
| 2007 | 1 | Thredd | $400M | 22.4% |
| 2016 | 4 | Form3, Modulr, Token.io, TrueLayer | $839M | 47.0% |
| 2017 | 2 | Upvest, Yapily | $361M | 20.2% |
| 2019 to 2020 | 2 | Pliant, Volt | $187M | 10.5% |
Source: Fintech Index Embedded Finance Study (Source 1), from the Fintech Index review pages for each provider (Sources 5 to 13).
Data: funding_by_year_founded.csv
Key Findings
- The four providers founded in 2016 raised $839 million, 47.0% of the total, which is an average of $210 million each.
- Thredd, founded in 2007, is the only provider in the study founded before 2016, and its $400 million is the largest single total.
- Pliant and Volt, founded in 2019 and 2020, raised $187 million combined, less than Form3, Modulr, or TrueLayer raised alone.
What the Forecasts and Funding Mean for Embedded Finance in 2026
Both forecasts point to growth, and they measure different things: Bain counts US revenue for software platforms and infrastructure providers, and Juniper counts revenue worldwide. Across the nine providers, private investors have put $1.79 billion into the category, with 50.9% going to providers of cards and accounts and 47.0% to providers founded in 2016.
Juniper expects global embedded finance revenue to rise from $162.6 billion in 2026 to $617 billion in 2031, with business-to-business products growing fastest, and Bain's forecast covers the United States only through 2026. Funding totals for the nine providers will change as they announce new rounds.
So if you are sizing an embedded finance opportunity, check whether each forecast covers the United States or the world and which providers it counts before you compare one with another.
Data Collection and Methodology
We reviewed published embedded finance forecasts and the funding, headquarters, founding year, segment, and rating data on Fintech Index review pages, collected in October 2026. The study covers privately held providers; public-market valuations and trading figures are not included. All money is in US dollars. Funding totals are the totals each review page states in dollars, most of them approximate. TrueLayer's pound-denominated rounds were converted on its review page at the Federal Reserve H.10 rate of $1.3375 per pound on October 23, 2026, and no other conversion was applied.
Terms. Embedded finance is the offer of financial products inside the software of a company that is not a financial institution. An infrastructure provider sells an account, card, payment, or investing product as a platform or API for other businesses to offer to their own customers. Open banking payments let a customer approve a payment directly from a bank account instead of using a card.
Provider selection. We included each infrastructure provider whose review page gives one total funding figure and whose reviewed product fits the definition in Terms: Form3, Modulr, Pliant, Thredd, Token.io, TrueLayer, Upvest, Volt, and Yapily. We excluded providers whose review pages give only a single funding round or mix funding bases, including Alpaca, DriveWealth, Liberis, Parafin, and YouLend. We assigned each included provider to one of three segments by its main reviewed product. The Fintech Index rating is the rounded average of the eight criterion scores on each review page.
Table notes. Bain's 2021 estimate of $21 billion is the figure in its press release summary; its detailed report uses $22 billion. Bain's figures cover US revenue for software platforms and enabling infrastructure providers, and Juniper's cover global embedded finance platform revenue, so the two series are not combined. Shares are computed from unrounded funding totals, and the segment shares sum to 99.9% and the founding-year shares to 100.1% because of rounding. Averages and medians are our calculations from the nine totals, with the average per provider rounded to the nearest million. Ratios and growth rates are calculated from the published values.
Sources
- Fintech Index Embedded Finance Study: analysis of funding, headquarters, founding year, and segment data for nine private infrastructure providers, and published revenue forecasts for 2021 to 2031, conducted October 2026
- Bain & Company and Bain Capital, Embedded finance transaction value to more than double to $7 trillion in US by 2026, 2022
- Juniper Research, Embedded Finance Revenue to Reach $617 Billion Globally by 2031, September 28, 2026
- Juniper Research via GlobeNewswire, Embedded Finance Revenue to Reach $617 Billion Globally by 2031 as B2B Revenue Surges 390%, September 28, 2026
- Fintech Index, Modulr review
- Fintech Index, Thredd review
- Fintech Index, Form3 review
- Fintech Index, Pliant review
- Fintech Index, Yapily review
- Fintech Index, Token.io review
- Fintech Index, TrueLayer review
- Fintech Index, Volt review
- Fintech Index, Upvest review