High-Yield Savings Rate Statistics: 2026 Report

Our analysts reviewed the FDIC's national deposit rates for every month from June 2024 to October 2026, the Federal Reserve's rate decisions over the same period, and the savings yields posted by the fintech companies we rate, as of Q4 2026. We charted how the average US savings rate moved against the fed funds rate, how much more a high-yield account at a fintech pays, and how rates changed for each type of deposit account.
A high-yield savings account is a savings account that pays well over the national average rate, usually offered by an online bank or by a fintech through a partner bank.
Key Findings
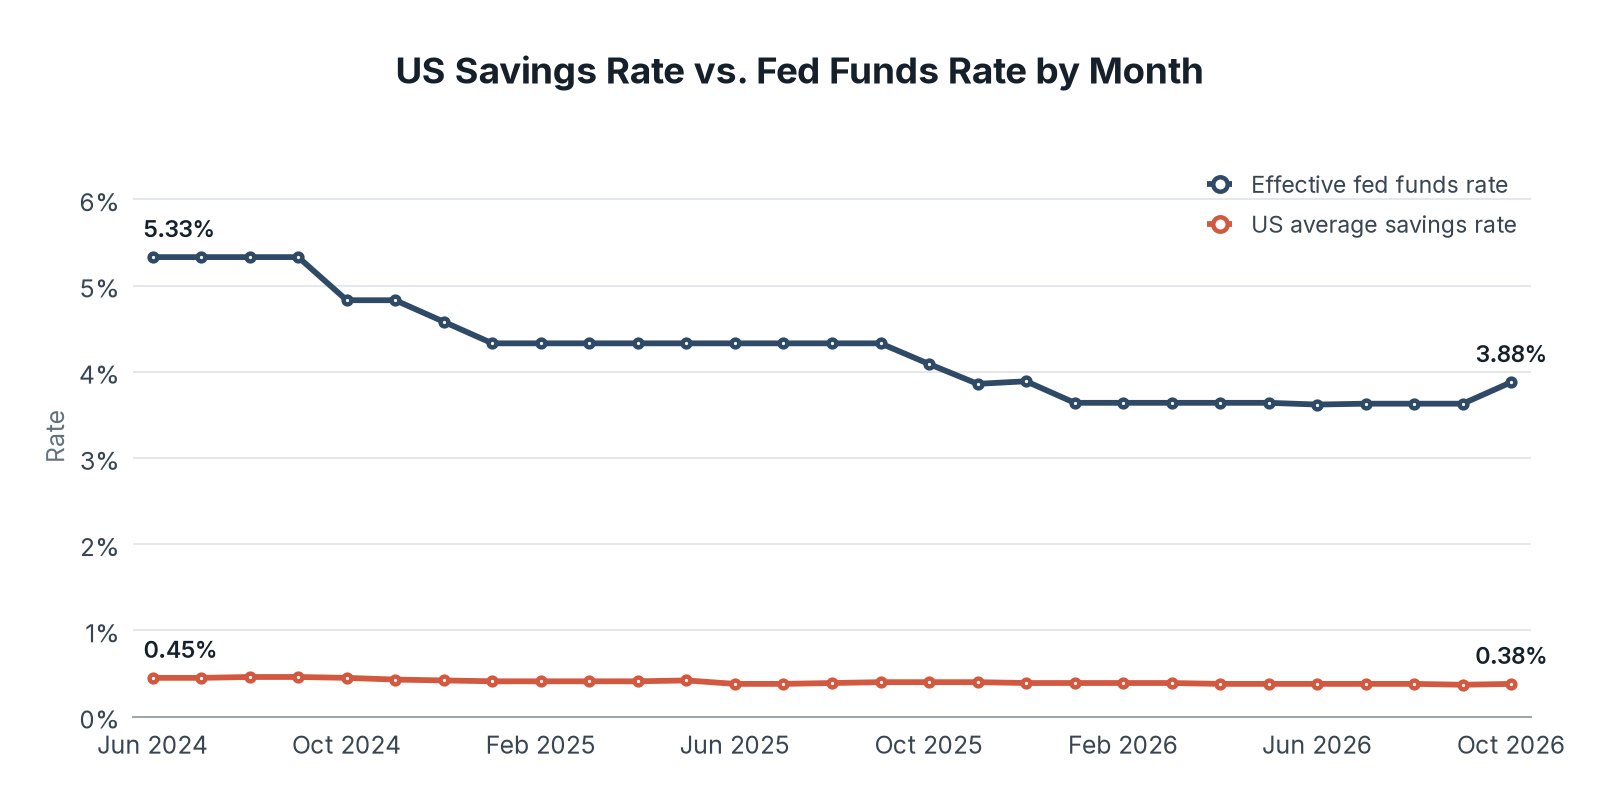
- The US national average savings rate was 0.38% in October 2026, down from 0.45% in June 2024, while the effective fed funds rate fell from 5.33% to 3.88%.
- The Federal Reserve cut its target range by a combined 1.75 percentage points between September 2024 and December 2025, but the average savings rate fell by only 0.07 points.
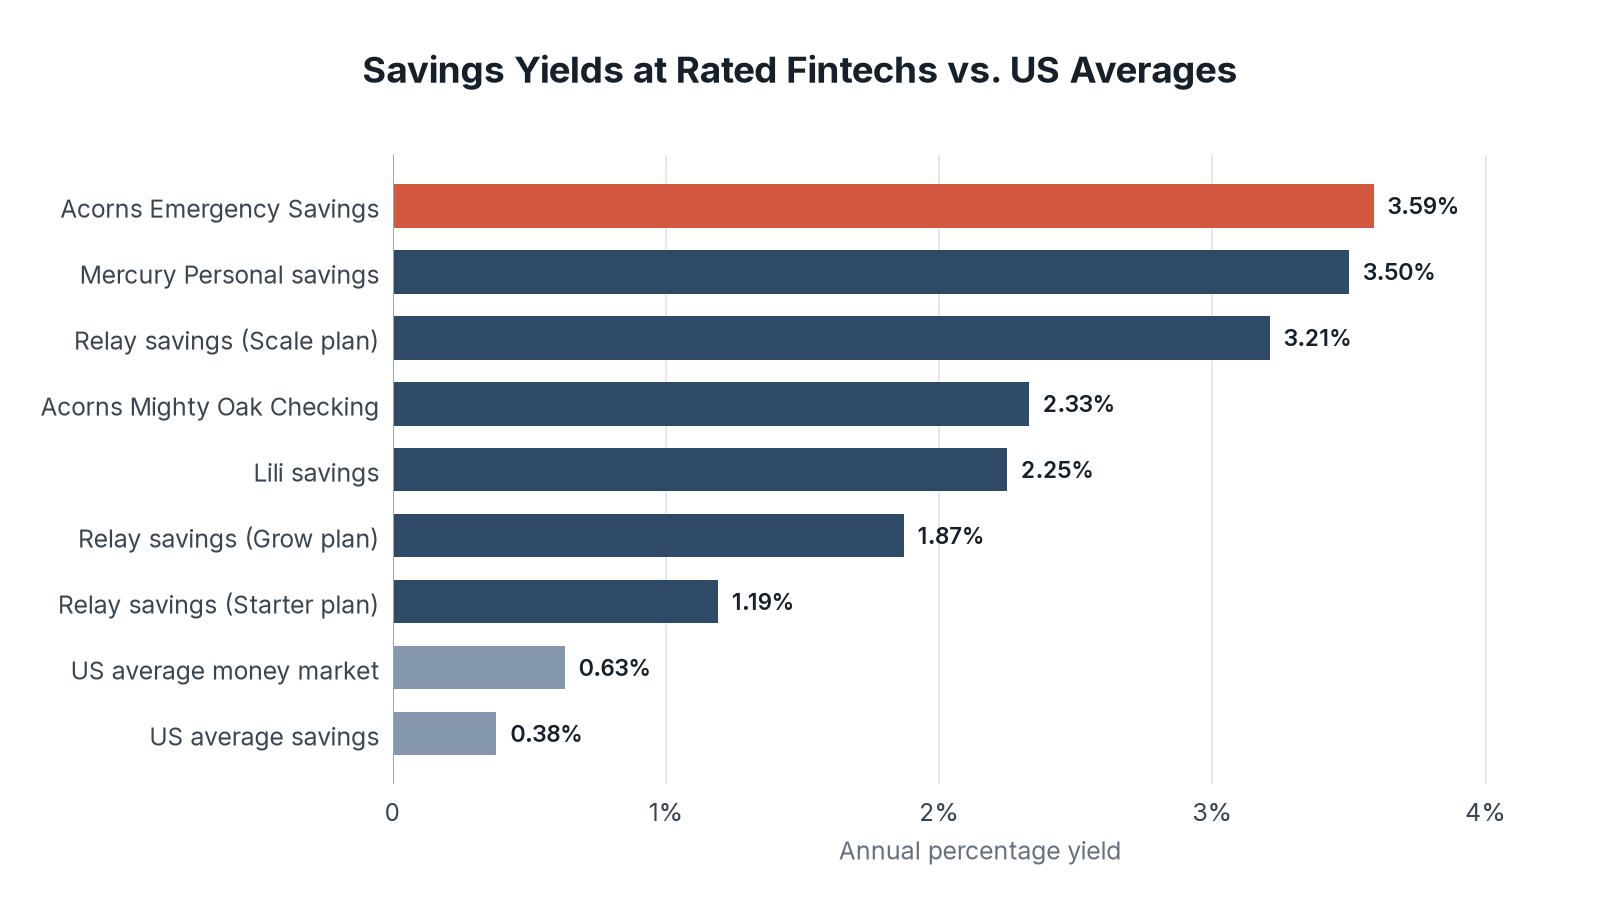
- The highest savings yield among the fintechs we rate was 3.59% at Acorns, more than nine times the national average.
- The average 12-month CD paid 1.76% in October 2026, more than four times the average savings rate.
The Average US Savings Rate Barely Moved as the Fed Cut Rates
The national average savings rate stayed between 0.37% and 0.46% for 29 months, while the effective fed funds rate swung by more than a point and a half. The gap between the two rates narrowed from 4.88 percentage points to 3.50 points.
| Month | US average savings rate | Effective fed funds rate |
|---|---|---|
| Jun 2024 | 0.45% | 5.33% |
| Jul 2024 | 0.45% | 5.33% |
| Aug 2024 | 0.46% | 5.33% |
| Sep 2024 | 0.46% | 5.33% |
| Oct 2024 | 0.45% | 4.83% |
| Nov 2024 | 0.43% | 4.83% |
| Dec 2024 | 0.42% | 4.58% |
| Jan 2025 | 0.41% | 4.33% |
| Feb 2025 | 0.41% | 4.33% |
| Mar 2025 | 0.41% | 4.33% |
| Apr 2025 | 0.41% | 4.33% |
| May 2025 | 0.42% | 4.33% |
| Jun 2025 | 0.38% | 4.33% |
| Jul 2025 | 0.38% | 4.33% |
| Aug 2025 | 0.39% | 4.33% |
| Sep 2025 | 0.40% | 4.33% |
| Oct 2025 | 0.40% | 4.09% |
| Nov 2025 | 0.40% | 3.86% |
| Dec 2025 | 0.39% | 3.89% |
| Jan 2026 | 0.39% | 3.64% |
| Feb 2026 | 0.39% | 3.64% |
| Mar 2026 | 0.39% | 3.64% |
| Apr 2026 | 0.38% | 3.64% |
| May 2026 | 0.38% | 3.64% |
| Jun 2026 | 0.38% | 3.62% |
| Jul 2026 | 0.38% | 3.63% |
| Aug 2026 | 0.38% | 3.63% |
| Sep 2026 | 0.37% | 3.63% |
| Oct 2026 | 0.38% | 3.88% |
Key Findings
- The Fed cut its target range six times between September 2024 and December 2025, from 5.25% to 5.50% down to 3.50% to 3.75%.
- On September 17, 2026, the Fed raised its target range by a quarter point to 3.75% to 4.00%, and the effective rate rose to 3.88% in October.
- The average savings rate did not respond to the September 2026 increase and stood at 0.38% in October, the same level as in April 2026.
Fintech Savings Accounts Pay Up to 3.59%
Fintechs we rate pay many times the national average on savings, though some of the top rates come with a paid plan. Yields are variable and change with market rates.
| Account | Annual percentage yield | Terms |
|---|---|---|
| Acorns Emergency Savings | 3.59% | All balances |
| Mercury Personal savings | 3.50% | Mercury Personal plan |
| Relay savings, Scale plan | 3.21% | Paid Scale plan |
| Acorns Mighty Oak Checking | 2.33% | Checking account |
| Lili savings | 2.25% | Balances up to $500,000 |
| Relay savings, Grow plan | 1.87% | Paid Grow plan |
| Relay savings, Starter plan | 1.19% | Free Starter plan |
| US average money market | 0.63% | National rate, October 2026 |
| US average savings | 0.38% | National rate, October 2026 |
Key Findings
- Mercury pays 3.50% on Mercury Personal savings, more than nine times the national average savings rate.
- Relay pays 1.19% on its free Starter plan and 3.21% on its Scale plan, so the Scale plan pays 2.7 times the Starter rate.
- Lili pays 2.25% on business savings balances up to $500,000 and 4.00% on balances between $500,000 and $1 million.
Every Type of US Deposit Account Pays Less Than in 2024
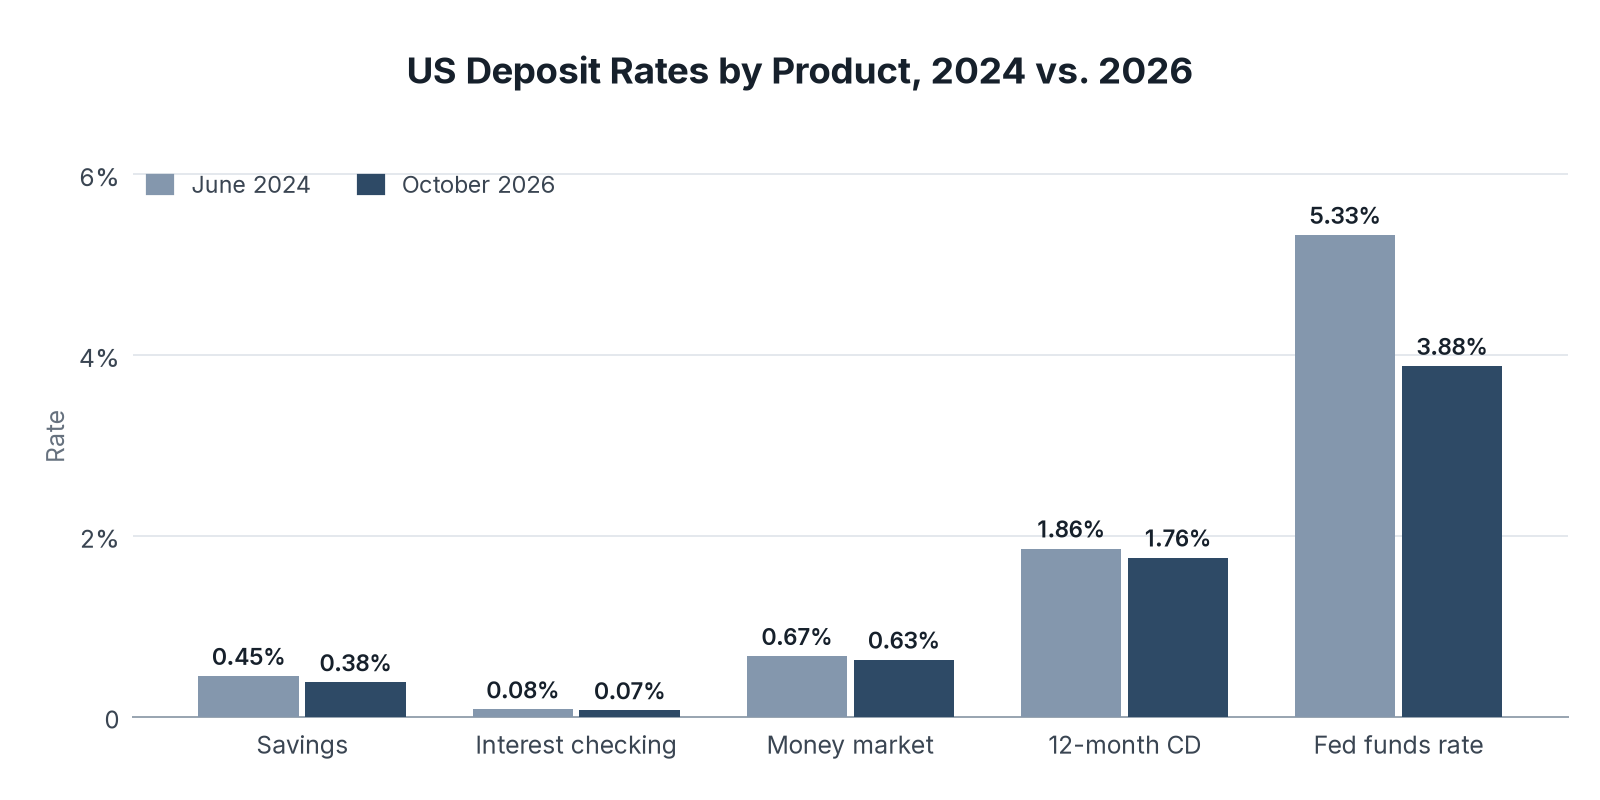
National average rates fell for savings, checking, money market accounts, and CDs between June 2024 and October 2026, though each fell by less than a fifth of a percentage point.
| Product | June 2024 | October 2026 |
|---|---|---|
| Savings | 0.45% | 0.38% |
| Interest checking | 0.08% | 0.07% |
| Money market | 0.67% | 0.63% |
| 12-month CD | 1.86% | 1.76% |
| Effective fed funds rate | 5.33% | 3.88% |
Key Findings
- The average 12-month CD rate fell from 1.86% to a low of 1.52% in March 2026, then recovered to 1.76% by October.
- The average money market rate fell to 0.56% in early 2026 and rose back to 0.63% by October.
- Interest checking paid 0.07% in October 2026, so a $10,000 balance would earn $7 in a year.
The Gap Between Average and High-Yield Savings Stays Wide
The average US savings account has paid less than half a percent for more than two years, whatever the Fed did. The top yields at the fintechs we rate, from 3.21% to 3.59%, come much closer to the fed funds rate of 3.88%.
Looking ahead, fintech yields are likely to follow the fed funds rate, while the national average is likely to stay near 0.4%. Our cash usage report tracks how often Americans still pay with cash.
So if you keep savings in an account paying the national average, moving them to a high-yield account at one of the fintechs we rate could earn you more than nine times as much interest, but check whether the top rate needs a paid plan.
Data Collection and Methodology
We reviewed sources available in Q4 2026. National average rates come from the FDIC's National Rates and Rate Caps, published monthly. The FDIC calculates each national rate as an average of rates paid by insured banks and branches, weighted by each institution's share of domestic deposits. The fed funds figures are the effective rates the FDIC publishes with each monthly table, and the target ranges come from the Federal Reserve's record of open market operations.
Fintech yields come from each company's own website or rate disclosure, retrieved on November 16, 2026, with the effective date shown by each company. We included every fintech we rate that posts a savings or interest-bearing account yield for US customers. Yields are annual percentage yields and are variable.
Sources
- Fintech Index, High-Yield Savings Rate Study: analysis of US national deposit rates and savings yields at rated fintech companies, conducted November 2026.
- FDIC, National Rates and Rate Caps, June 2024 to October 2026
- Board of Governors of the Federal Reserve System, Open Market Operations
- Acorns, rate disclosures, September 22, 2026
- Mercury, Personal Banking
- Relay, Pricing
- Lili, high-yield savings disclosures, January 13, 2026
- Table 1: Source: FDIC, National Rates and Rate Caps, monthly, June 2024 to October 2026. Data: us_savings_rate_vs_fed_funds_monthly.csv
- Chart 1: Source: FDIC, National Rates and Rate Caps, monthly, June 2024 to October 2026.
- Table 2: Source: Acorns, Mercury, Relay, and Lili rate disclosures; FDIC, National Rates and Rate Caps, October 2026. Data: apy_at_rated_companies.csv
- Chart 2: Source: Acorns, Mercury, Relay, and Lili rate disclosures; FDIC, National Rates and Rate Caps, October 2026.
- Table 3: Source: FDIC, National Rates and Rate Caps, June 2024 and October 2026. Data: us_deposit_rates_by_product.csv
- Chart 3: Source: FDIC, National Rates and Rate Caps, June 2024 and October 2026.