Cash Usage Statistics: 2026 Report

Our analysts reviewed ten years of the Federal Reserve's payment diary of US consumers, the European Central Bank's 2024 study of payments in the euro area, and UK Finance's payment figures for 2025, as of Q4 2026. We charted how many payments Americans make each month with cash and cards, who still pays with cash, and cash's share of payments in the US, the UK, and across the euro area.
Cash usage here means the share or number of payments people make with banknotes and coins, as opposed to cards, bank transfers, and payment apps.
Key Findings
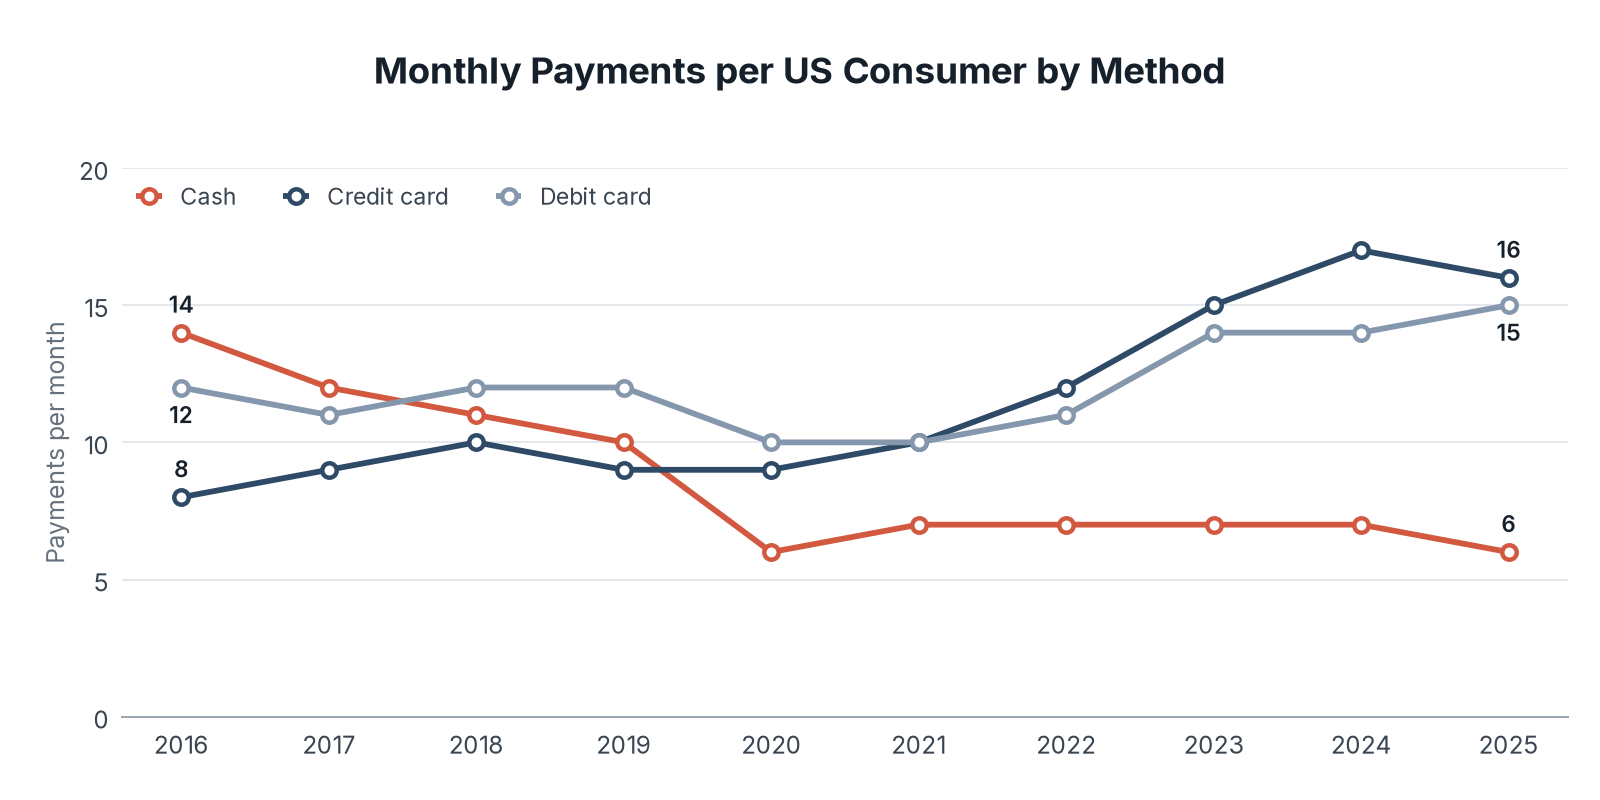
- The average US consumer made 6 cash payments a month in 2025, down from 14 in 2016, while credit card payments doubled from 8 to 16.
- Cash made up 14% of all US payments in 2025, down from about a third in 2016, and around 20% of in-person payments.
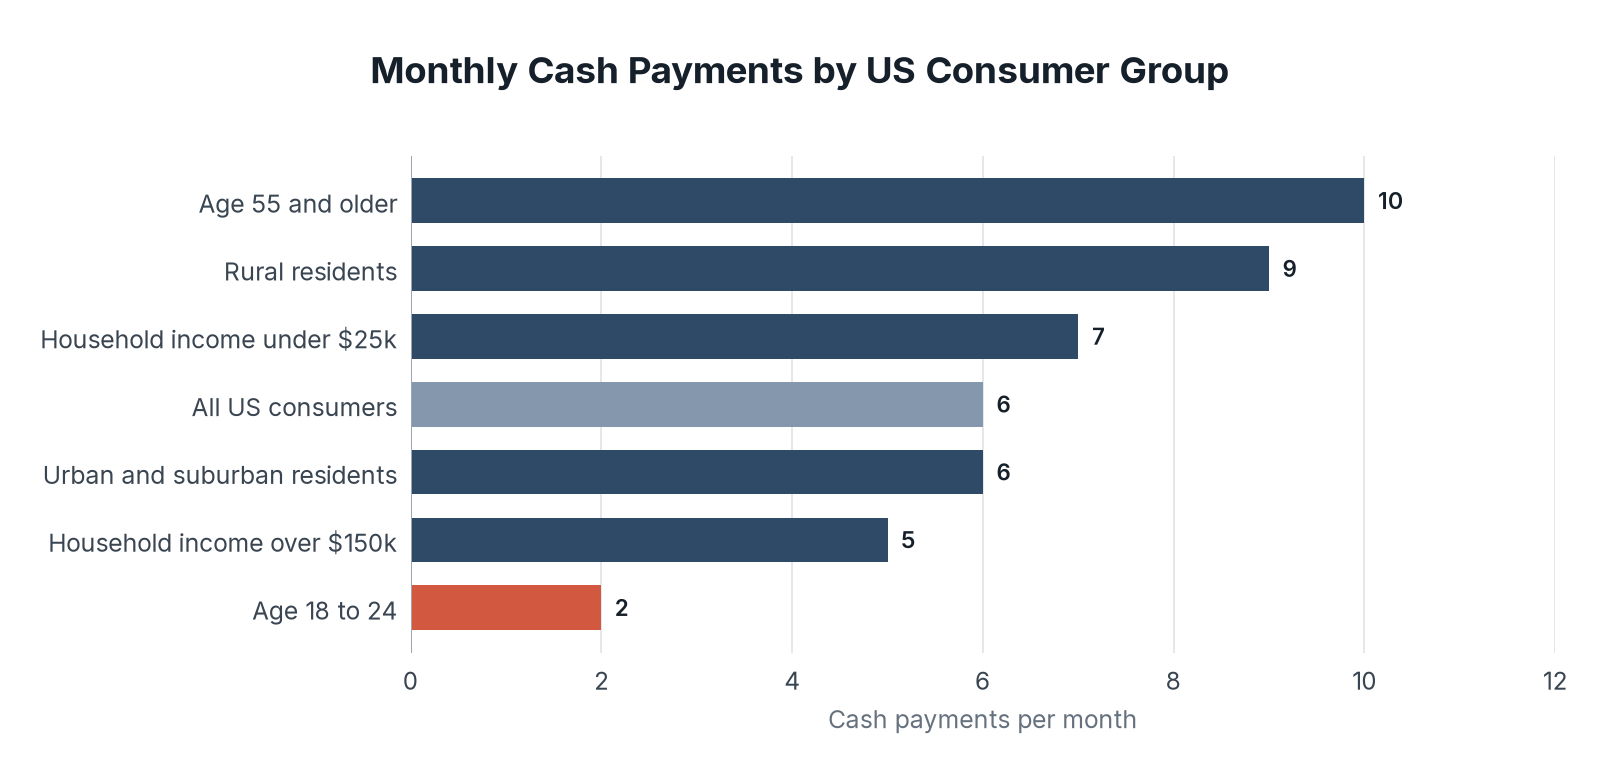
- Americans aged 55 and older made 10 cash payments a month in 2025, five times as many as consumers aged 18 to 24.
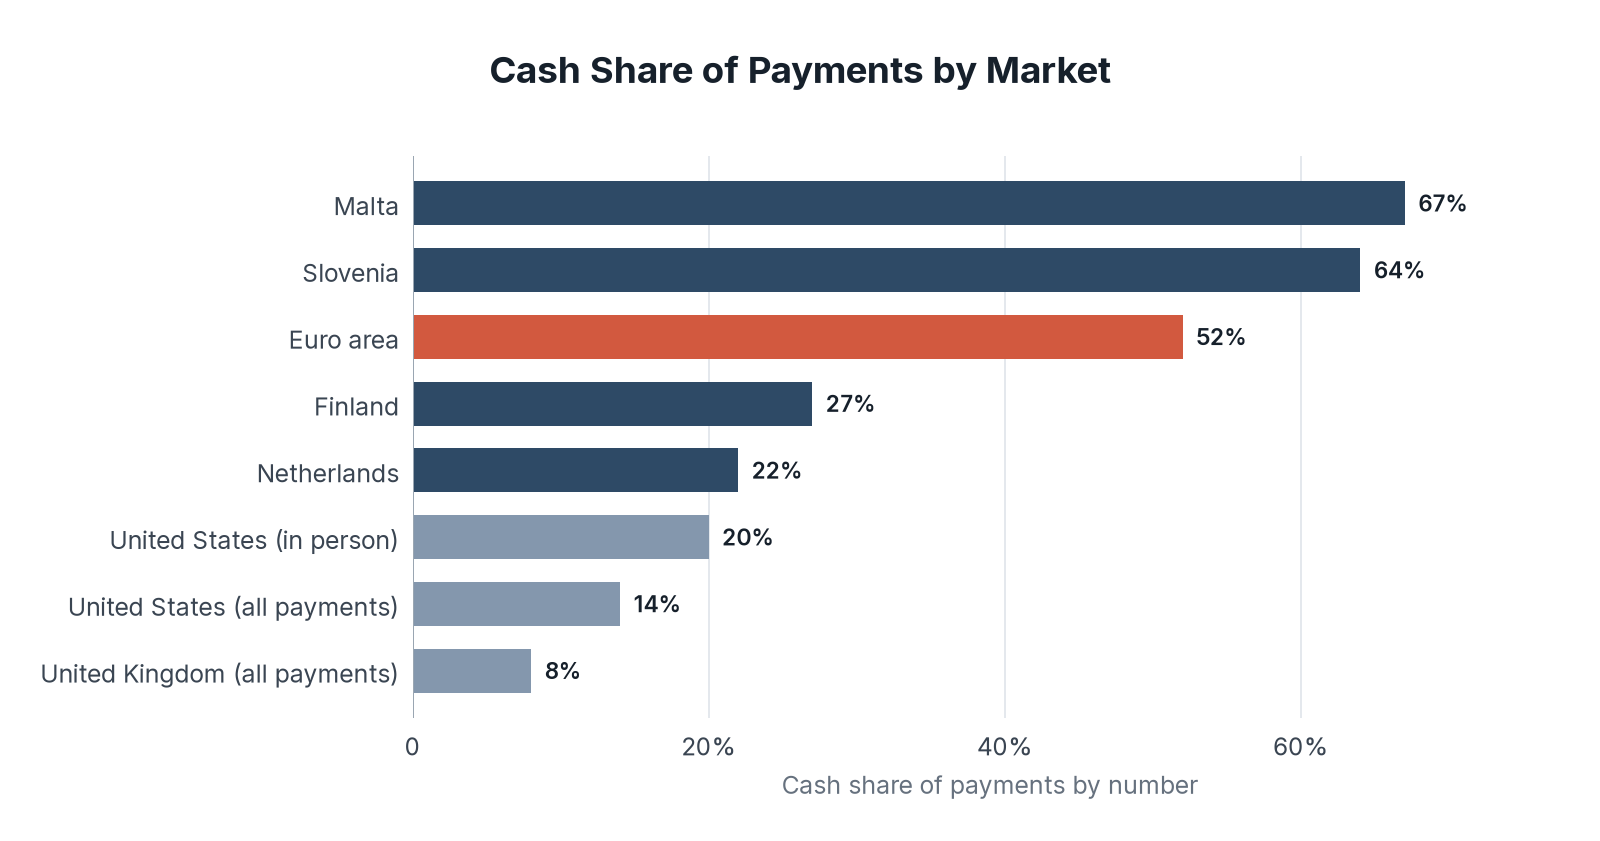
- Cash was used for 52% of in-store payments in the euro area in 2024 but only 8% of all payments in the UK in 2025, down from 45% in 2015.
US Cash Payments Fell From 14 to 6 a Month Over the Decade
Cash was the most-used way to pay in the US in 2016. By 2025 it was third, behind credit and debit cards, and most of the drop came in 2020.
| Year | Cash | Credit card | Debit card | All payments |
|---|---|---|---|---|
| 2016 | 14 | 8 | 12 | 45 |
| 2017 | 12 | 9 | 11 | 41 |
| 2018 | 11 | 10 | 12 | 43 |
| 2019 | 10 | 9 | 12 | 38 |
| 2020 | 6 | 9 | 10 | 35 |
| 2021 | 7 | 10 | 10 | 36 |
| 2022 | 7 | 12 | 11 | 39 |
| 2023 | 7 | 15 | 14 | 46 |
| 2024 | 7 | 17 | 14 | 48 |
| 2025 | 6 | 16 | 15 | 47 |
Key Findings
- Cash payments fell from 10 to 6 a month between 2019 and 2020 and have stayed between 6 and 7 since.
- In-person payments under $25 held at 17 a month in 2025, but cash covered 5 of them, down from 11 in 2016.
- Five out of six US cash payments in 2025 were for less than $25.
Older, Rural, and Lower-Income Americans Use the Most Cash
The gap in cash use between groups has widened since 2016, when cash made up about a third of payments regardless of age and a similar number of payments at every income level.
| Group | Cash payments per month, 2025 |
|---|---|
| Age 55 and older | 10 |
| Rural residents | 9 |
| Household income under $25,000 | 7 |
| All US consumers | 6 |
| Urban and suburban residents | 6 |
| Household income over $150,000 | 5 |
| Age 18 to 24 | 2 |
Key Findings
- Four out of five US consumers used cash at least once in the 30 days before the survey, and more than 90% have no plans to stop.
- 76% of consumers carried cash, with an average of $69 on hand, and 45% kept cash elsewhere for savings or emergencies, with an average of $364, up from $306 in 2024.
- Cash was the most preferred way to pay in person for 16% of US consumers, behind debit and credit cards.
Cash Covers 52% of Euro Area In-Store Payments but 8% of UK Payments
Cash use varies widely between countries. It is still the most common way to pay in shops in most euro area countries, while it has fallen to a small share of payments in the UK.
| Market | Cash share of payments | Measure |
|---|---|---|
| Malta | 67% | In-store payments, 2024 |
| Slovenia | 64% | In-store payments, 2024 |
| Euro area | 52% | In-store payments, 2024 |
| Finland | 27% | In-store payments, 2024 |
| Netherlands | 22% | In-store payments, 2024 |
| United States | 20% | In-person payments, 2025 |
| United States | 14% | All payments, 2025 |
| United Kingdom | 8% | All payments, 2025 |
Key Findings
- Cash's share of euro area in-store payments fell from 72% in 2019 to 59% in 2022 and 52% in 2024, and by value it fell to 39%, behind cards at 45%.
- Consumers aged 65 and older in the euro area used cash for 57% of in-store payments, while those under 40 used it for less than half.
- UK cash payments fell to 3.9 billion in 2025 from 4.3 billion in 2024, and UK Finance expects cash to make up 4% of UK payments by 2035.
Cash Is Shrinking Slowly but Holding a Floor
Cash use dropped sharply in 2020 and has barely moved since. Americans still make about six cash payments a month, mostly small in-person purchases, and older, rural, and lower-income consumers rely on it most. In Europe, cash still covers half of in-store payments, while the UK has moved furthest toward cards and bank transfers.
Looking ahead, cash should keep losing share as younger consumers who rarely use it make up more of the population and as instant bank payments spread, but more than 90% of Americans plan to keep using it. Our [real-time payments report](/reports/realtime-payments-adoption-statistics-2026/) and [digital wallet report](/reports/digital-wallet-transaction-volume-statistics-2026/) track the methods taking its place.
So if you run a business that serves older, rural, or lower-income customers, keep accepting cash, because those groups still make a large share of their in-person purchases with it.
Data Collection and Methodology
We reviewed sources available in Q4 2026. US figures come from the Federal Reserve's Survey and Diary of Consumer Payment Choice, in which a representative sample of US adults records every payment over three days. The counts are average payments per consumer per month and include bills, purchases, and payments to other people. The 2016 to 2025 counts are as published in the 2026 findings, which round each figure to a whole number.
Euro area figures come from the European Central Bank's 2024 Study on the Payment Attitudes of Consumers in the Euro Area, which covers point-of-sale and person-to-person payments in the 20 euro area countries. UK figures come from UK Finance's UK Payment Markets 2026 report and cover all payments made in the UK in 2025.
The measures differ by source: the euro area figures cover in-store payments, and the US and UK figures shown as all payments cover every payment type, so the euro area shares run higher partly for that reason.
Sources
- The Fintech Index analysis of rated companies, November 2026
- Federal Reserve Financial Services, 2026 Findings from the Diary of Consumer Payment Choice
- European Central Bank, Study on the Payment Attitudes of Consumers in the Euro Area (SPACE) 2024
- UK Finance, UK Payment Markets 2026, August 19, 2026
- The Standard, Cash Expected to Make Up Just 4% of Payments by 2035 as Digital Innovation Grows, August 18, 2026
- Table 1: Source: Federal Reserve Financial Services, 2026 Findings from the Diary of Consumer Payment Choice. Data: us_monthly_payments_by_method.csv
- Chart 1: Source: Federal Reserve Financial Services, 2026 Findings from the Diary of Consumer Payment Choice.
- Table 2: Source: Federal Reserve Financial Services, 2026 Findings from the Diary of Consumer Payment Choice. Data: us_cash_payments_by_group.csv
- Chart 2: Source: Federal Reserve Financial Services, 2026 Findings from the Diary of Consumer Payment Choice.
- Table 3: Source: European Central Bank, SPACE 2024; Federal Reserve Financial Services, 2026 Diary of Consumer Payment Choice; UK Finance, UK Payment Markets 2026. Data: cash_share_by_market.csv
- Chart 3: Source: European Central Bank, SPACE 2024; Federal Reserve Financial Services, 2026 Diary of Consumer Payment Choice; UK Finance, UK Payment Markets 2026.