Unbanked Household Statistics: 2026 Report

Our analysts reviewed the FDIC National Survey of Unbanked and Underbanked Households for 2009 through 2023, the Federal Reserve's Survey of Household Economics and Decisionmaking for 2025, and the World Bank's Global Findex 2025, as of Q4 2026. We charted how the US unbanked rate changed over 14 years, who is most likely to be unbanked, and how the rate differs by race and ethnicity.
An unbanked household is one in which no one has a checking or savings account at a bank or credit union. The Federal Reserve applies the same idea to adults, counting an adult as unbanked when neither they nor a spouse or partner has a checking, savings, or money market account.
Key Findings
- 4.2% of US households, or 5.6 million households, were unbanked in 2023, the lowest rate since the FDIC survey began in 2009.
- 6% of US adults were unbanked in 2025, a rate that has held steady since 2021.
- 21% of adults with family income under $25,000 were unbanked in 2025, against 1% of adults with income of $100,000 or more.
- Worldwide, 1.3 billion adults had no account in 2024, while 79% of adults had one, up from 74% in 2021.
The US Unbanked Rate Fell by Almost Half Between 2011 and 2023
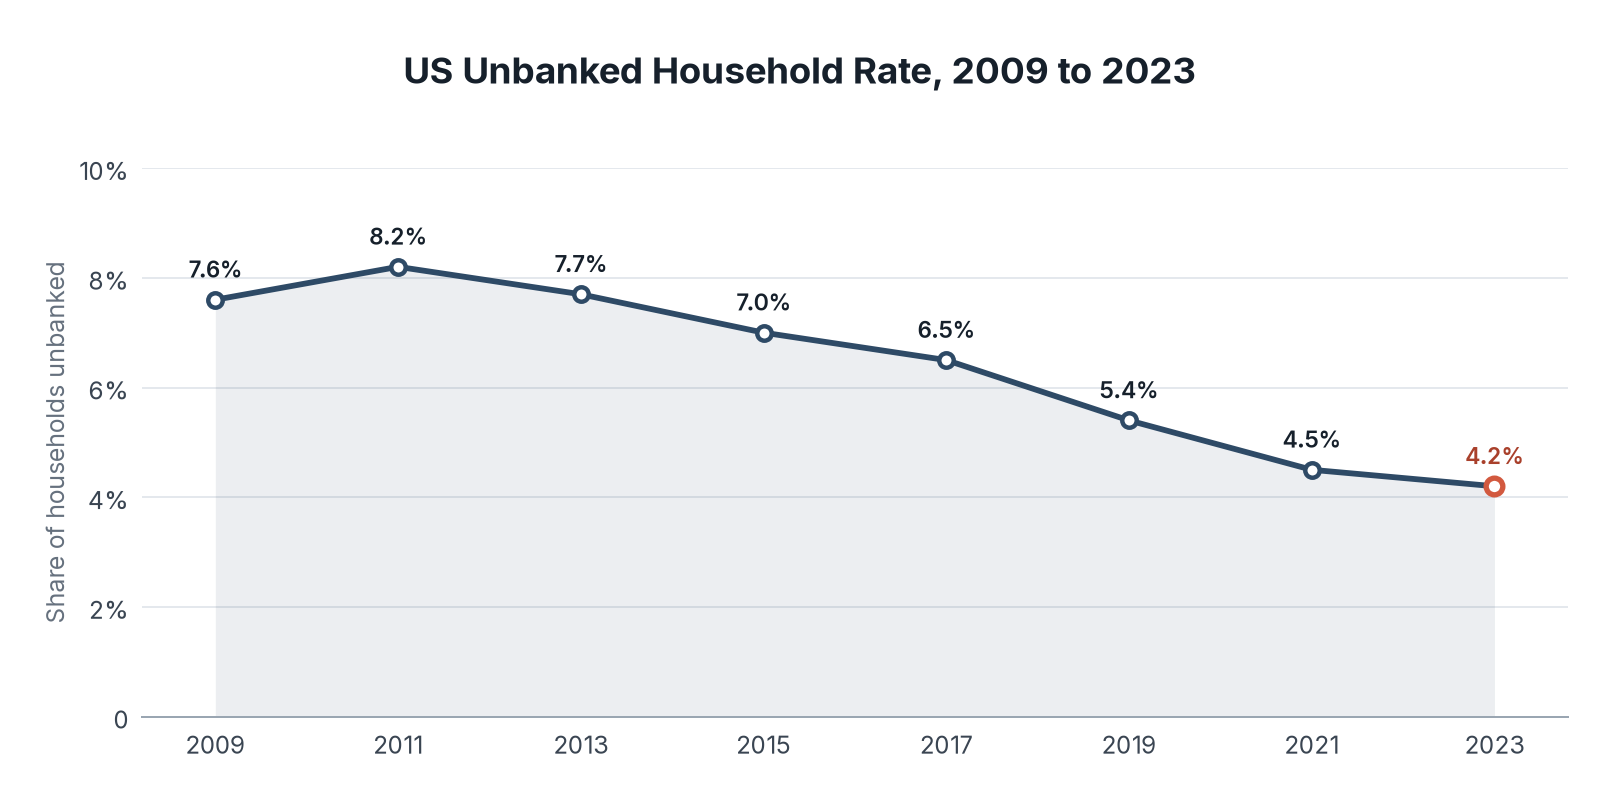
The share of US households without a bank account peaked at 8.2% in 2011 and fell in every survey after that, to 4.2% in 2023. The fall from 2021 to 2023 was small, and the FDIC did not find it statistically significant.
| Survey year | Unbanked households |
|---|---|
| 2009 | 7.6% |
| 2011 | 8.2% |
| 2013 | 7.7% |
| 2015 | 7.0% |
| 2017 | 6.5% |
| 2019 | 5.4% |
| 2021 | 4.5% |
| 2023 | 4.2% |
Key Findings
- The fall from 8.2% in 2011 to 4.2% in 2023 equals 5.3 million more banked households, and the FDIC links two thirds of the decline to higher incomes and education levels.
- 14.2% of US households, or 19.0 million, were underbanked in 2023, meaning they had a bank account but also used nonbank services such as check cashing, money orders, or payday loans.
- Two thirds of unbanked households (66.2%) relied entirely on cash in 2023, and the other third used prepaid cards or nonbank apps such as PayPal, Venmo, or Cash App.
One in Five Adults With Income Under $25,000 Has No Bank Account
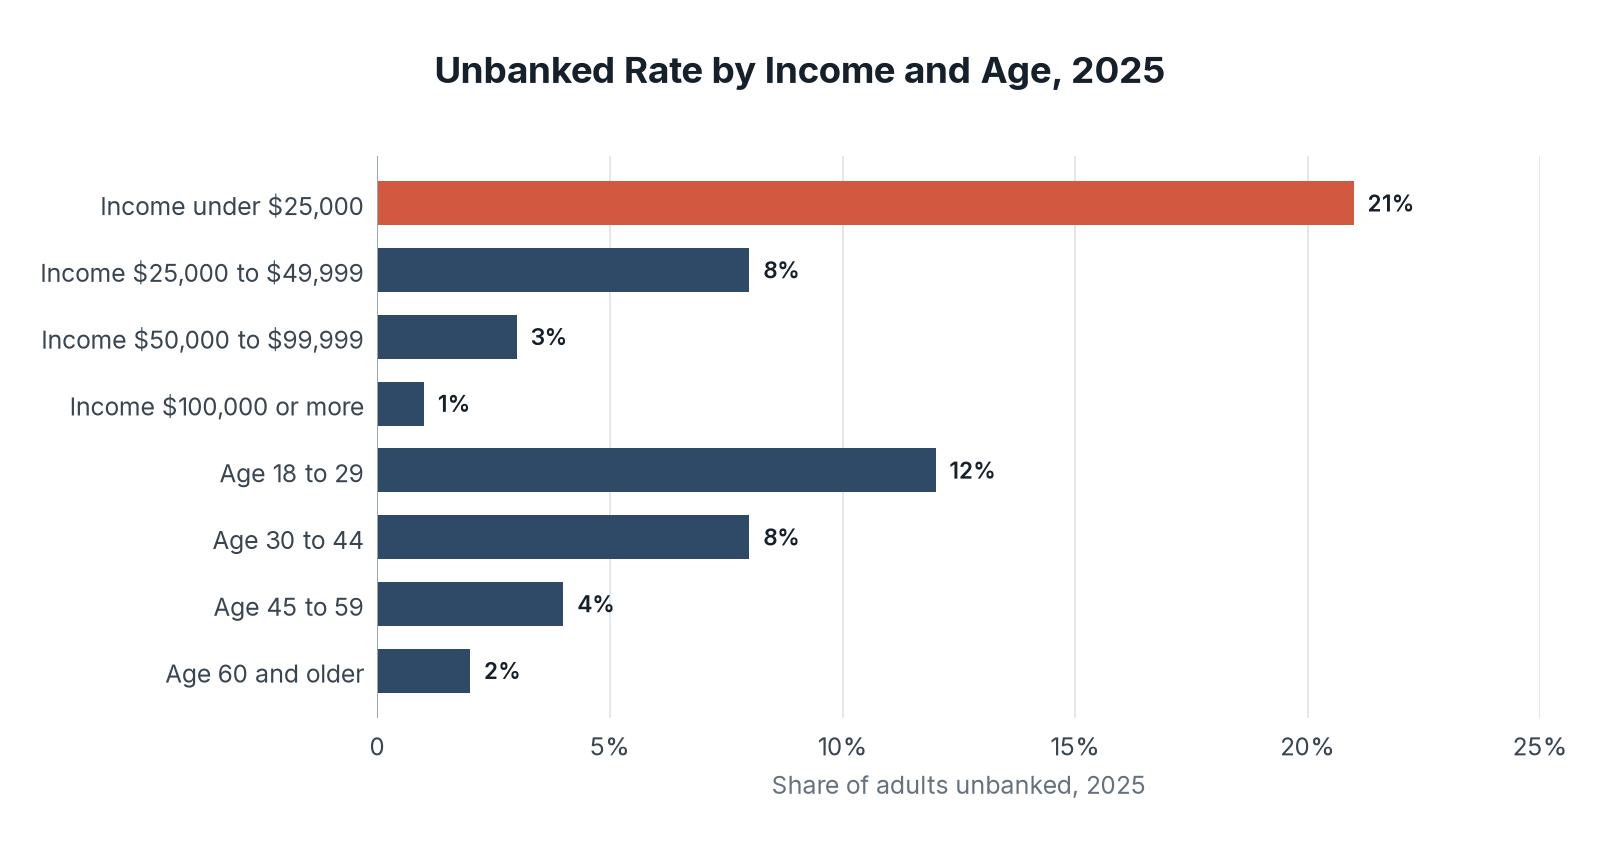
Income is the strongest divide. Adults with family income under $25,000 were 21 times as likely to be unbanked in 2025 as adults earning $100,000 or more, and adults aged 18 to 29 were six times as likely as adults aged 60 and older.
| Group | Category | Unbanked adults |
|---|---|---|
| Family income | Under $25,000 | 21% |
| Family income | $25,000 to $49,999 | 8% |
| Family income | $50,000 to $99,999 | 3% |
| Family income | $100,000 or more | 1% |
| Age | 18 to 29 | 12% |
| Age | 30 to 44 | 8% |
| Age | 45 to 59 | 4% |
| Age | 60 and older | 2% |
Key Findings
- The most cited reason for having no account in 2023 was "Don't have enough money to meet minimum balance requirements," given by 42.3% of unbanked households and the main reason for 23.3%.
- "Don't trust banks" was the second most common main reason, at 15.7% of unbanked households, and one third (33.4%) gave a main reason tied to fees or minimum balances.
- 28% of unbanked adults used a nonbank money order or check cashing service in 2025, compared with 11% of adults with a bank account.
Black and Hispanic Households Are at Least Five Times as Likely to Be Unbanked as White Households
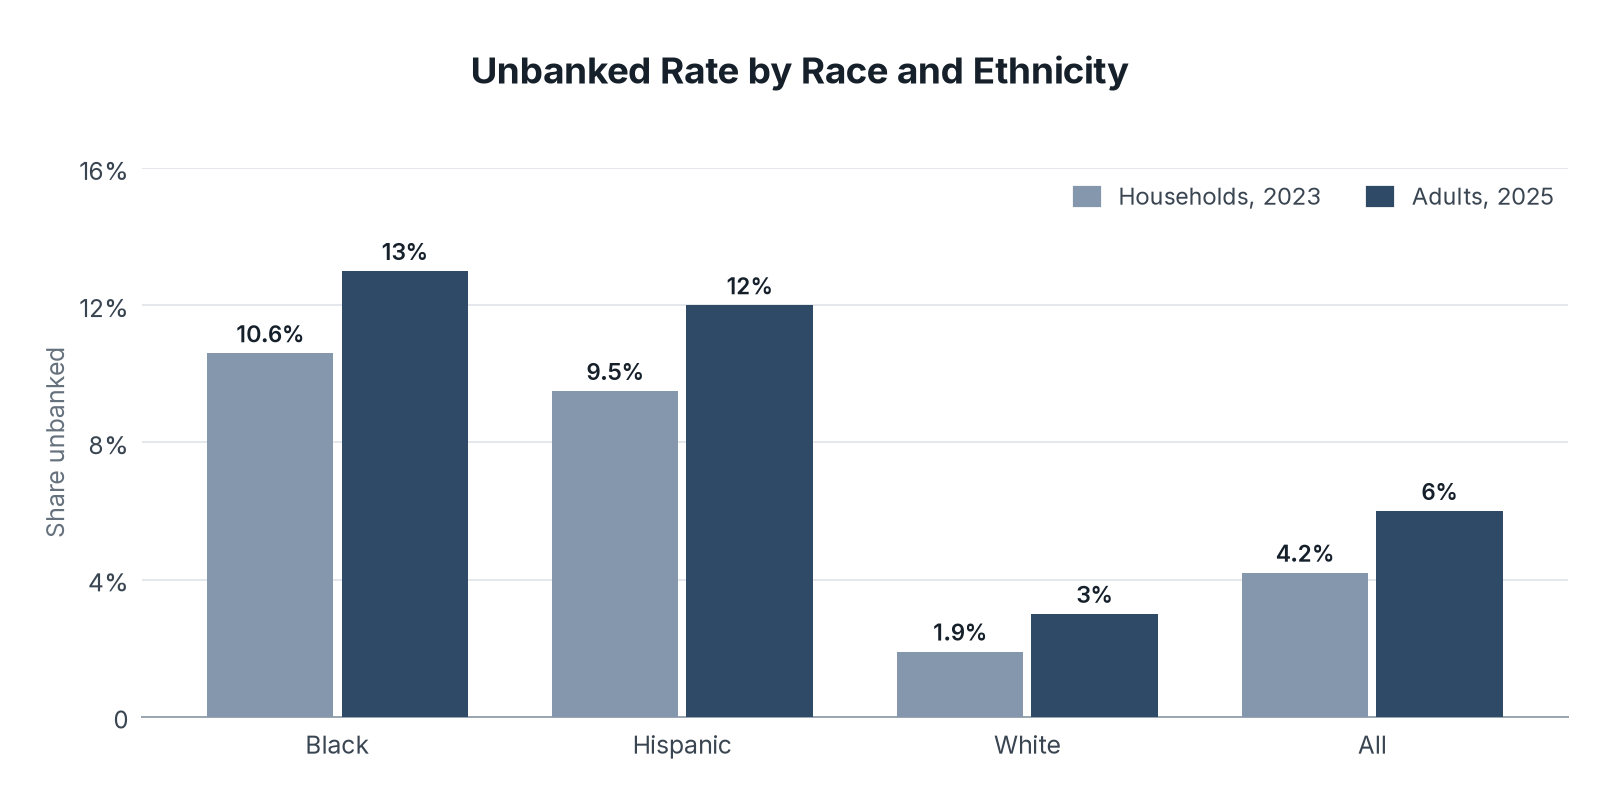
The gap by race and ethnicity has narrowed since 2011 but is still wide in both surveys. In 2023, 10.6% of Black households and 9.5% of Hispanic households were unbanked, compared with 1.9% of White households, and the gap was present at every income level.
| Race or ethnicity | Households, 2023 | Adults, 2025 |
|---|---|---|
| Black | 10.6% | 13% |
| Hispanic | 9.5% | 12% |
| White | 1.9% | 3% |
| All | 4.2% | 6% |
Key Findings
- 12.2% of American Indian or Alaska Native households were unbanked in 2023, the highest rate of any group the FDIC tracks.
- Among households earning $50,000 to $75,000 in 2023, 3.5% of Black households and 4.5% of Hispanic households were unbanked, compared with 0.8% of White households.
- Black households made up 12.9% of all US households in 2023 but 32.3% of unbanked households, and Hispanic households made up 14.8% of all households but 33.4% of the unbanked.
Fewer Households Are Unbanked, but the Gaps Remain
The US unbanked rate has fallen by almost half since 2011, and it has held close to its lowest level for the last four years. Most of the remaining unbanked households have low incomes, and the main reasons they give are minimum balances, fees, and distrust of banks.
The same pattern shows up worldwide. The World Bank counts 1.3 billion adults without an account, and around 900 million of them own a mobile phone, which gives banks and fintech apps a way to reach them. Our overdraft fee report and neobank customer report cover the fees that push some households away and the apps that try to win them back.
So if you are building a product for unbanked customers, start with no minimum balance and no surprise fees, because those are the reasons unbanked households give most often for staying out of banks.
Data Collection and Methodology
We reviewed sources available in Q4 2026. US household figures come from the FDIC National Survey of Unbanked and Underbanked Households, which the FDIC has run every two years since 2009. The 2023 survey was conducted in June 2023 and collected responses from 29,483 households. It is the most recent FDIC survey with published results as of Q4 2026.
US adult figures come from the Federal Reserve's 2025 Survey of Household Economics and Decisionmaking, published in May 2026. The Federal Reserve counts adults, and the FDIC counts households, so the two rates differ and are best compared within each survey over time. Global figures come from the World Bank's Global Findex 2025, which covers account ownership in 2024 and counts accounts at a bank, a similar financial institution, or a mobile money provider.
Sources
- Fintech Index, Unbanked Household Study: analysis of FDIC, Federal Reserve, and World Bank survey data, conducted November 2026.
- FDIC, 2023 FDIC National Survey of Unbanked and Underbanked Households, November 2024
- FDIC, FDIC Survey Finds 96 Percent of US Households Were Banked in 2023, November 12, 2024
- Board of Governors of the Federal Reserve System, Economic Well-Being of US Households in 2025: Banking, May 2026
- World Bank, The Global Findex Database 2025
- BIIA, Financial Inclusion at Record High, but 1.3 Billion Still Unbanked: World Bank Global Findex 2025 Report
- Table 1: Source: FDIC, 2023 National Survey of Unbanked and Underbanked Households. Data: fdic_unbanked_rate_by_year.csv
- Chart 1: Source: FDIC, 2023 National Survey of Unbanked and Underbanked Households.
- Table 2: Source: Board of Governors of the Federal Reserve System, Economic Well-Being of US Households in 2025, May 2026. Data: shed_unbanked_rate_by_income_and_age_2025.csv
- Chart 2: Source: Board of Governors of the Federal Reserve System, Economic Well-Being of US Households in 2025, May 2026.
- Table 3: Source: FDIC, 2023 National Survey of Unbanked and Underbanked Households; Board of Governors of the Federal Reserve System, Economic Well-Being of US Households in 2025. Data: unbanked_rate_by_race_fdic_2023_vs_shed_2025.csv
- Chart 3: Source: FDIC, 2023 National Survey of Unbanked and Underbanked Households; Board of Governors of the Federal Reserve System, Economic Well-Being of US Households in 2025.