Robo-Advisor Assets Under Management Statistics: 2026 Report

Digital wealth apps hold investments and savings for customers, but the assets they report can include different products. Comparing their size requires knowing which accounts each figure covers.
Our analysts reviewed public asset, customer, and fee disclosures for digital wealth platforms in Q4 2026. We compared disclosed book sizes, calculated assets per customer where dates could be matched, and compared headline annual fees. Non-US figures use fixed Federal Reserve exchange rates.
The comparisons below keep asset definitions and reporting dates visible, separating book size, assets per customer and annual fees.
Key Findings
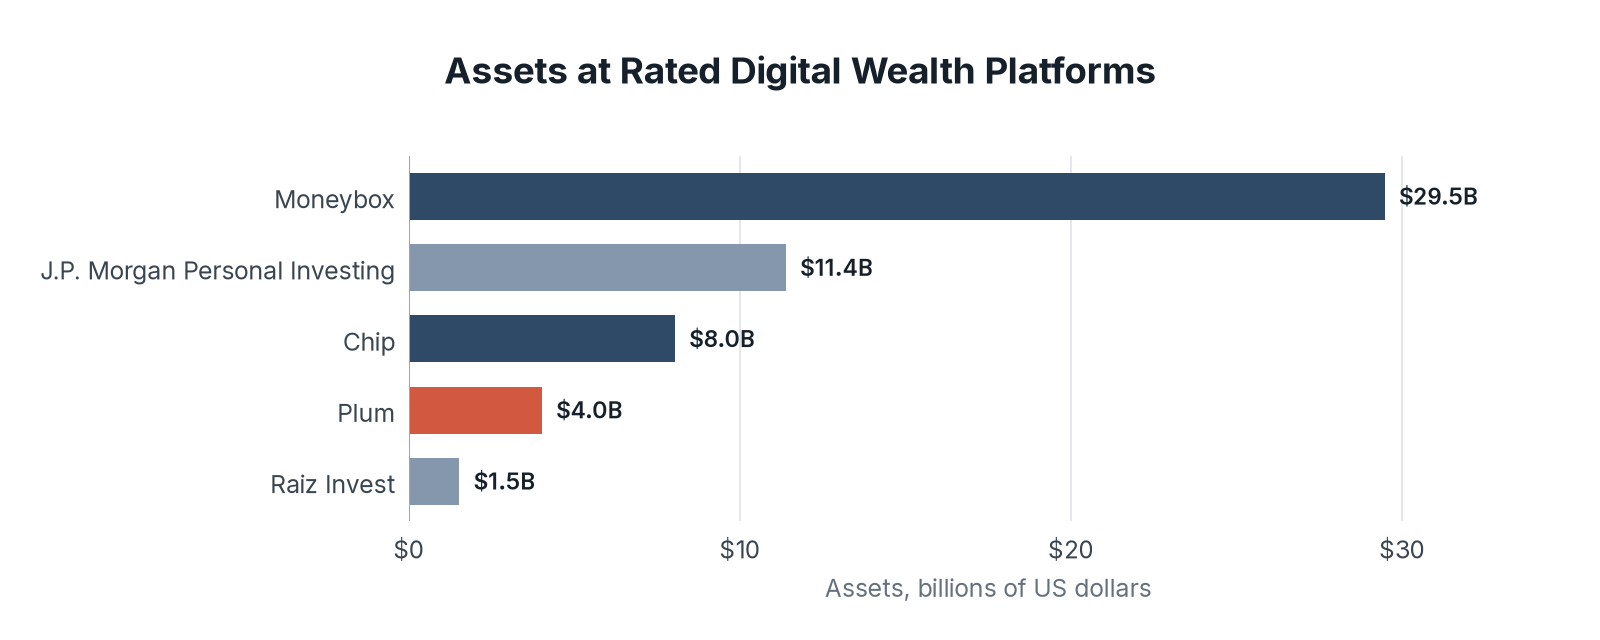
- Moneybox reported about $29.5B of assets under administration as of April 2026, the largest AUA figure among the platforms in this cut.
- J.P. Morgan Personal Investing disclosed about $11.4B of assets under management across more than 265,000 investors.
- Chip reported about $8.0B of assets with more than 500,000 active users.
- Headline management fees among managed UK platforms still cluster near 0.6% to 0.7%, while InvestEngine markets zero platform fees on DIY ETF investing.
How Large the Disclosed Books Are
We pulled the latest public asset figures from the platforms we rate that disclose AUM, AUA, or a close equivalent. This cut mixes discretionary-managed portfolios, optional self-directed retail apps, and disclosed assets under each firm’s own label, so the table shows book size rather than a single legal definition of a robo-advisor.
| Platform | Assets (USD) | Metric disclosed |
|---|---|---|
| Moneybox | About $29.5B | AUA, April 2026; disclosed as more than $29.48B |
| J.P. Morgan Personal Investing | About $11.4B | AUM, October 2025; rounded disclosure floor |
| Chip | About $8.0B | AUA, January 2026 |
| Plum | About $4.0B | Assets through app including cash ISAs, April 2026 |
| Raiz Invest | About $1.53B | AUM, April 24, 2026 |
Key Findings
- Moneybox leads this rated set on disclosed AUA after its April 2026 update. The table includes cash and investment accounts. Its ranking describes disclosed assets across those products.
- Three UK or UK-led platforms hold the top three USD books in the table. That concentration is a book-size fact, not proof that managed robo portfolios dominate every retail wealth app. Self-directed brokers in the same cut sit lower on disclosed assets.
- Smaller disclosed books still matter for product teams benchmarking retail scale. Legal asset labels differ by firm, so a smaller AUM line can still be a full consumer product. Use the metric column before treating any row as comparable growth.
Book Size Divided by Customers
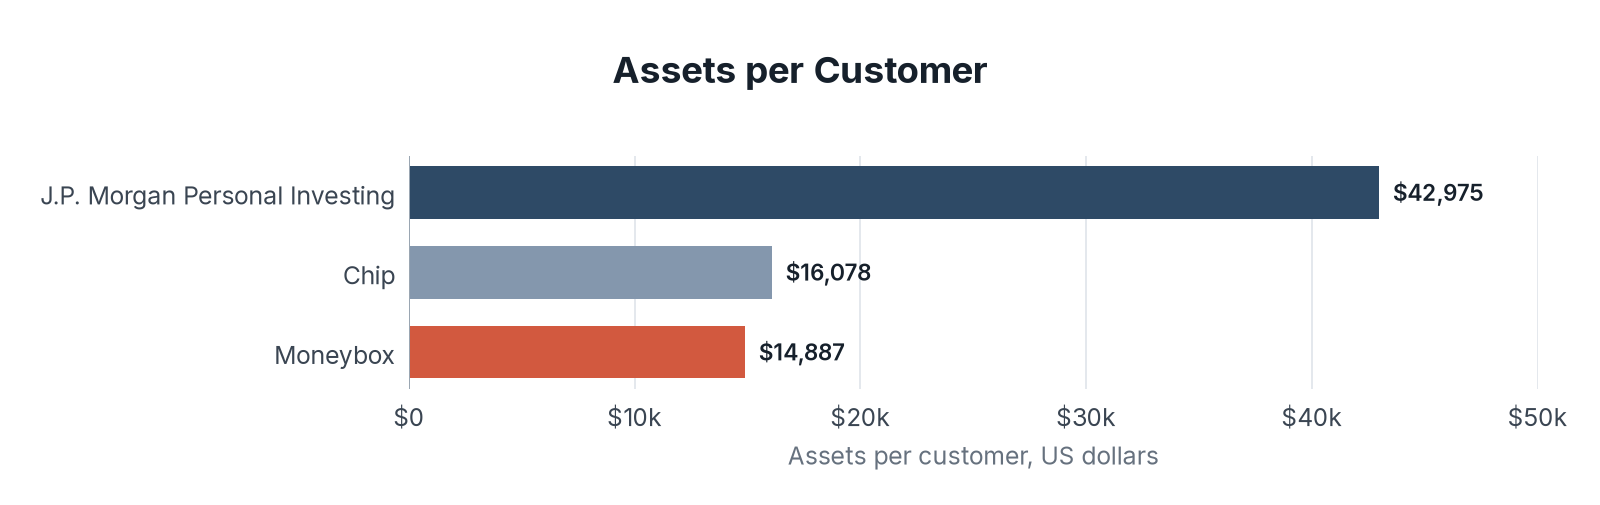
We divided disclosed assets by disclosed customer or investor counts where both figures were public. The result is a rough book-per-customer signal, not a profit measure.
| Platform | Customers | Assets (USD) | Assets per customer |
|---|---|---|---|
| J.P. Morgan Personal Investing | More than 265,000 | About $11.4B | About $43,000 |
| Moneybox, end-2025 | 1.71 million | About $25.4B | About $15,000 |
| Chip | More than 500,000 | About $8.0B | About $16,000 |
Key Findings
- J.P. Morgan Personal Investing shows the highest assets per investor in this cut. Both the asset and investor figures are rounded disclosure floors. Their ratio is an approximation, not a measured average account balance.
- Moneybox and Chip land near the mid-teens thousands despite different product mixes. The customer definitions and reporting dates differ. These ratios do not measure profit per customer.
- Moneybox’s customer ratio uses its end-2025 results so the numerator and denominator share a reporting date. Its later April 2026 asset headline is used only in the book-size table.
What Investors Pay
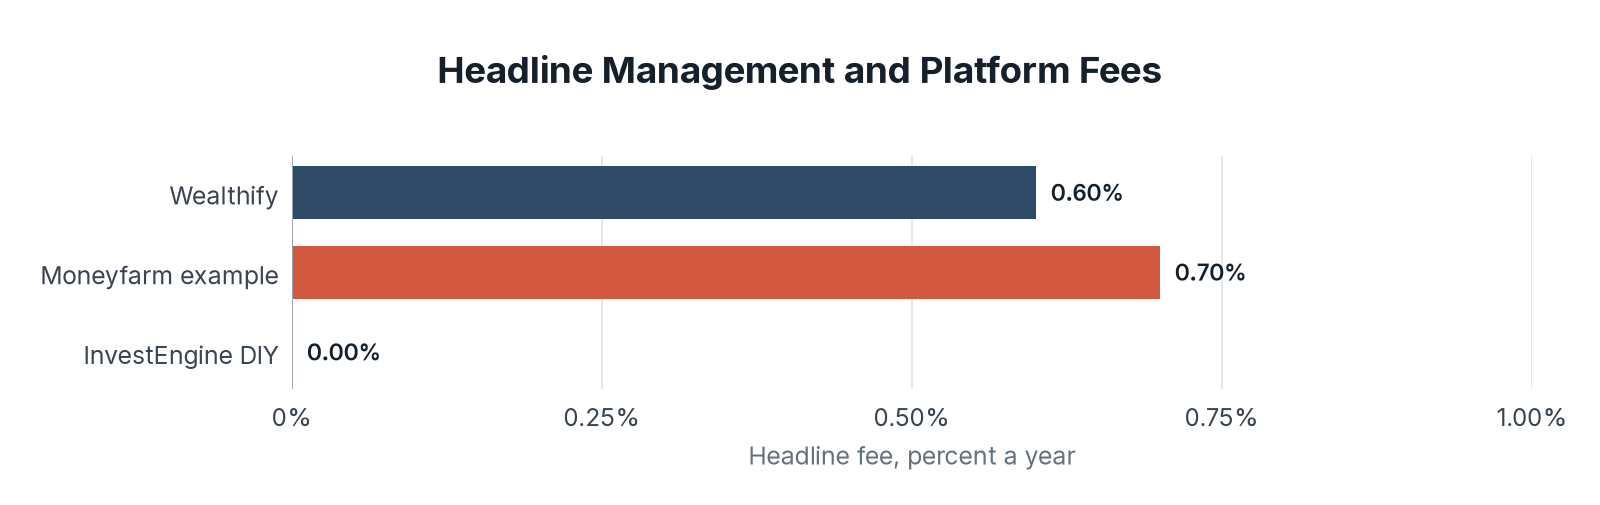
Fee design still splits the category. Some platforms charge an AUM management fee. Others use zero platform fees with fund costs on top.
| Platform | Headline fee | Notes |
|---|---|---|
| Wealthify | 0.60% a year | Fund and trading costs about 0.14% to 0.46% on top |
| Moneyfarm | About 0.70% combined | 0.45% management plus 0.25% platform on an example $26,800 portfolio |
| InvestEngine DIY | 0% platform fee | ETF provider charges still apply |
Key Findings
- Managed UK digital wealth fees remain close to classic robo pricing near 0.6%. Fund and trading costs still sit on top of that headline. Buyers comparing ISAs need the all-in stack, not the management line alone.
- DIY ETF platforms compete by cutting platform fees to zero and leaving fund costs visible. That shift changes how a fee table should be read. A zero platform fee is not a zero-cost portfolio.
- An all-in comparison still needs fund costs and account type, not the headline platform fee alone. Subscription models outside this three-row fee cut are a different unit of comparison. Keep those offers on a separate sheet when you benchmark.
Comparing Portfolio Size and Ongoing Fees
Large disclosed books still concentrate among a few scaled consumer brands, while fee competition is strongest on DIY ETF rails. A saver comparing managed portfolios should weigh the all-in fee, including fund costs, against the convenience of a ready-made portfolio. A product team benchmarking the category should separate AUM fee platforms from zero-platform-fee DIY apps before treating any single number as the market price.
Looking ahead, the platforms in this set still disclose AUM and AUA on different calendars and definitions, so year-to-year growth comparisons need care. Cross-border USD conversions also move with Fed H.10 rates.
So if you are sizing a digital wealth competitor or choosing a managed ISA, start with the disclosed book and the all-in fee on the exact account you would open, then compare that pair across two or three platforms rather than chasing a single industry average.
Data Collection and Methodology
We reviewed disclosures available in Q4 2026. Each asset row retains its company metric and disclosure date. Sterling figures use $1.3398 per pound and Australian figures use $0.7038 per Australian dollar, the Federal Reserve H.10 rates for October 30, 2026. Original currencies are converted once at these fixed rates.
Moneybox reported more than 22 billion pounds of AUA in April 2026, or more than $29.4756B, shown as about $29.5B. Its customer ratio uses the matching end-2025 figures: 19.0 billion pounds times 1.3398 equals $25.4418B, divided by 1.71 million customers equals $14,878.25. The company rounds its original-currency average to 11,200 pounds, equivalent to $15,005.76. Both support the displayed approximation of $15,000.
J.P. Morgan’s more-than-8.5-billion-pound disclosure converts to a floor of $11.3883B, rounded to about $11.4B. Dividing that floor by the disclosed 265,000-investor floor gives $42,974, shown as about $43,000. A ratio of two floors is not a mathematical bound on the true average. Chip’s January 2026 release gives 6 billion pounds of AUA ($8.0388B) and more than 500,000 active customers. We use that release’s active-customer headline; its separate boilerplate refers to 400,000 users. The floor-based ratio is about $16,078. Plum’s around-3-billion-pound figure converts to $4.0194B and includes cash ISAs. Raiz’s reported 2.17 billion Australian dollars converts to $1.527246B.
Moneyfarm’s originally quoted 20,000-pound example converts to $26,796, shown as $26,800. Its management and platform fees total 0.70% before fund costs. Fees describe the specific products shown, and customer ratios use rounded public figures. We did not survey customers.
Sources
- The Fintech Index study and collection of publicly disclosed digital wealth data, Q4 2026
- Moneybox annual results and April 2026 update
- City AM, J.P. Morgan Personal Investing launch
- Chip January 2026 funding release
- Plum April 2026 profitability release
- Sydney Morning Herald, Raiz April 2026 assets
- Wealthify pension fees
- Wealthify ISA fund costs
- Moneyfarm pricing
- InvestEngine platform fees
- Federal Reserve H.10 exchange rates
- Table, Assets at Rated Digital Wealth Platforms: Source: The Fintech Index collection of Moneybox, Chip and Plum disclosures, with City AM on J.P. Morgan and the Sydney Morning Herald on Raiz. Data: robo_aum_by_platform.csv
- Chart, Assets at Rated Digital Wealth Platforms: Source: The Fintech Index collection of Moneybox, Chip and Plum disclosures, with City AM on J.P. Morgan and the Sydney Morning Herald on Raiz. Asset definitions differ: Moneybox and Chip report AUA, J.P. Morgan and Raiz AUM, and Plum assets through its app including cash ISAs. Sources and dates are listed in the table and Sources.
- Table, Assets per Customer at Platforms With Both Figures: Source: The Fintech Index calculations from Moneybox end-2025 results, Chip’s January 2026 release and J.P. Morgan’s October 2025 disclosure reported by City AM. Data: robo_aum_per_customer.csv
- Chart, Assets per Customer at Platforms With Both Figures: Source: The Fintech Index calculations from Moneybox end-2025 results, Chip’s January 2026 release and J.P. Morgan’s October 2025 disclosure reported by City AM. Floor-based estimates for J.P. Morgan and Chip; Moneybox uses matching end-2025 assets and customers. CSV values retain unrounded calculations.
- Table, Headline Fee Patterns: Source: Wealthify pension and ISA fee pages, Moneyfarm pricing and InvestEngine’s DIY platform fee page. Data: robo_management_fees.csv
- Chart, Headline Fee Patterns: Source: Wealthify pension and ISA fee pages, Moneyfarm pricing and InvestEngine’s DIY platform fee page. Annual headline fees. Moneyfarm combines management and platform fees on a $26,800 example; fund costs remain additional.