RIA Valuation Multiples: 2026 Report

Our analysts reviewed 2,249 announced deals for registered investment advisers (RIAs) and other wealth managers from 2020 through September 2026, counted by ECHELON Partners and DeVoe & Company, along with median multiples from Advisor Growth Strategies and Piper Sandler for 2018 through 2025 and the disclosed terms of two LPL Financial acquisitions, to understand what RIA valuation multiples look like as of Q4 2026.
Key Findings
- Wealth managers with at least $5 billion in assets sold for a median 21.0 times earnings before interest, taxes, depreciation, and amortization (EBITDA) in 2024, compared with 12.5 times for smaller firms (Piper Sandler).
- The median EBITDA multiple paid for RIAs was 11.6 times in 2025, up from 8.0 times in 2020 (Advisor Growth Strategies).
- LPL Financial's $2.7 billion purchase of Commonwealth Financial Network, announced in March 2025, equals 22.5 times the EBITDA LPL expected to acquire at closing.
- ECHELON Partners counted 466 announced RIA and wealth management deals in 2025, up 27.3% from 2024.
When the owner of an RIA, an independent firm that mostly charges clients a yearly fee tied to the assets it manages, decides to sell, the price is usually described as a multiple of the firm's EBITDA. Buyers range from the firm's own partners planning a succession to other RIAs and private-equity-backed consolidators. Those multiples appear in deal announcements and industry reports, but each publisher collects a different set of deals and measures earnings its own way, so the same firm can look cheap or expensive depending on the figure it is set against.
In the following sections, we compare multiples by seller size, median multiples by year, the terms of two large deals with published prices, deal volume, the mix of sellers in 2026, and the factors publishers say move a multiple.
RIA Valuation Multiples Rise With Seller Size
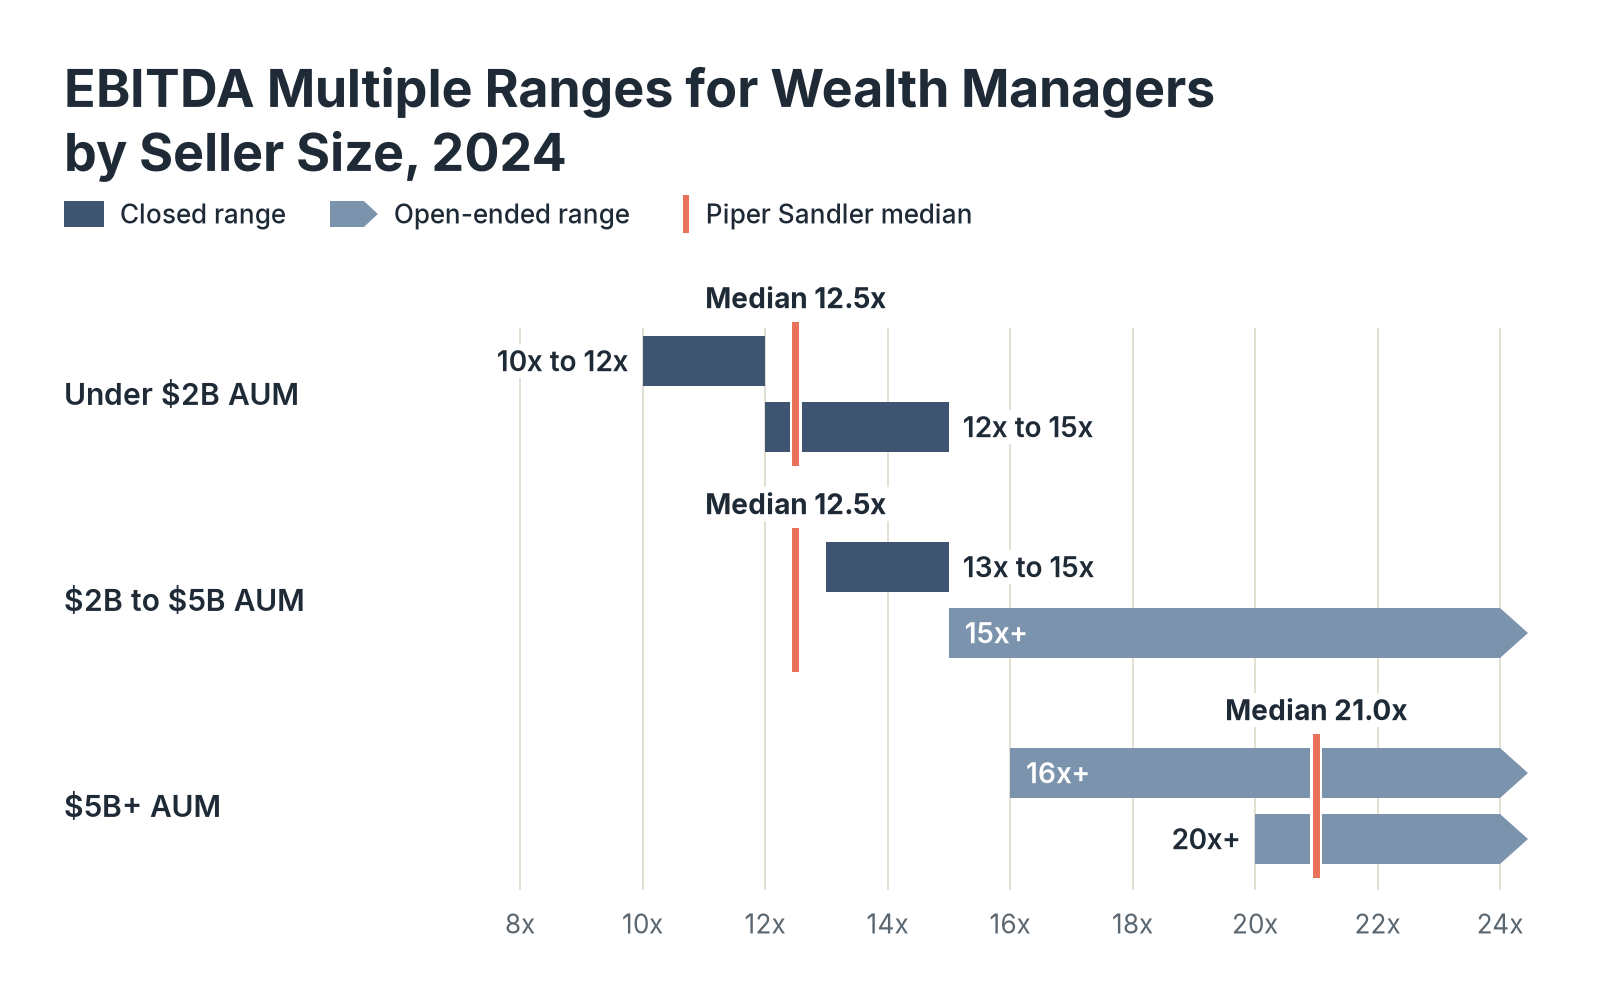
Anyone pricing an RIA wants to know first whether a quoted multiple came from a firm of similar size. Piper Sandler's 2024 transaction review is the clearest public source on that question, because it reports a median for smaller and larger sellers and prints a range of multiples for each size band.
| Seller AUM | Piper Sandler median, run-rate EBITDA | Multiple ranges shown by Piper Sandler |
|---|---|---|
| Under $2B | 12.5x (all sellers under $5B) | 10x to 12x; 12x to 15x |
| $2B to $5B | 12.5x (all sellers under $5B) | 13x to 15x; 15x+ |
| $5B+ | 21.0x | 16x+; 20x+ |
Source: Fintech Index RIA Valuation Study (Source 1), from Piper Sandler's 2024 transaction review (Source 6).
Data: multiples_by_seller_size_2024.csv
Key Findings
- Each step up in size raises the bottom of the range, from 10 times for firms under $2 billion to 16 times for firms with $5 billion or more.
- The 13 times to 15 times range printed for sellers with $2 billion to $5 billion in assets falls inside the 12 times to 15 times range printed for sellers under $2 billion.
- Because the two smaller bands overlap, a firm under $5 billion can command the same multiple as one twice its size, and only sellers above $5 billion sit in a clearly higher bracket.
Median RIA Multiples Climbed in Most Years From 2020 to 2025
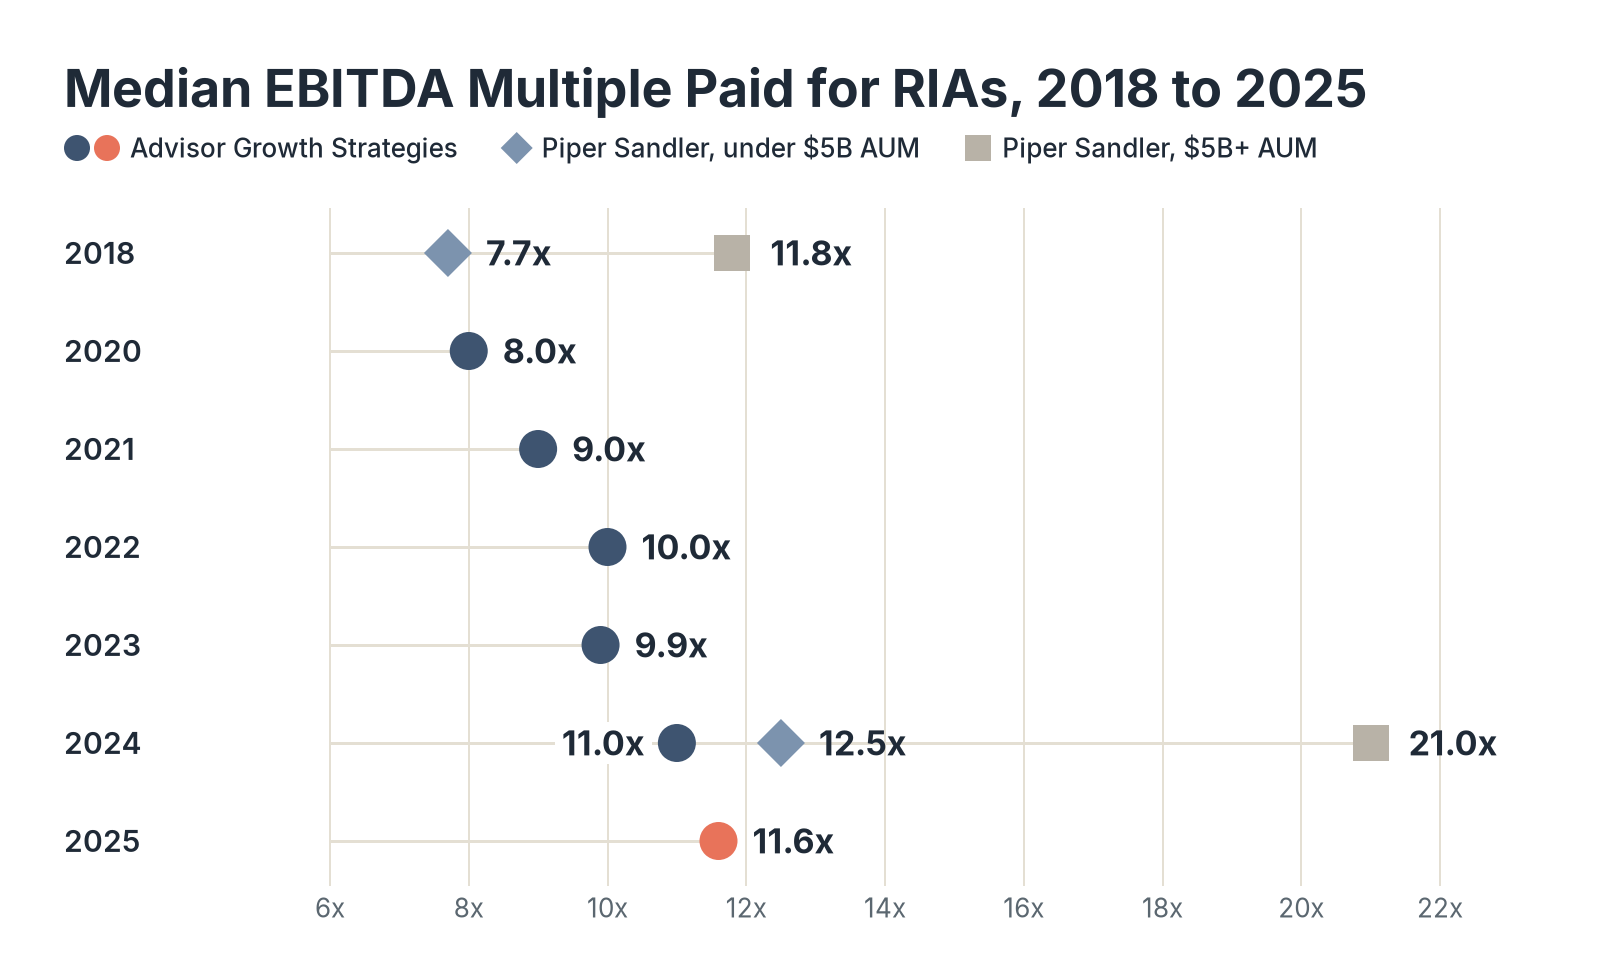
A multiple quoted today means more when it can be set against earlier years, so we gathered every annual median that Advisor Growth Strategies (AGS) and Piper Sandler have published since 2018 and placed them in one table.
| Year | AGS median, adjusted EBITDA | Piper Sandler median, sellers under $5B AUM | Piper Sandler median, sellers with $5B+ AUM |
|---|---|---|---|
| 2018 | n/a | 7.7x | 11.8x |
| 2020 | 8.0x | n/a | n/a |
| 2021 | 9.0x | n/a | n/a |
| 2022 | 10.0x | n/a | n/a |
| 2023 | 9.9x | n/a | n/a |
| 2024 | 11.0x | 12.5x | 21.0x |
| 2025 | 11.6x | n/a | n/a |
Source: Fintech Index RIA Valuation Study (Source 1), from Advisor Growth Strategies, WealthManagement.com, and Piper Sandler median multiples, 2018 to 2025 (Sources 2 to 6).
Data: median_multiple_by_year.csv
Key Findings
- The AGS median rose in every year from 2020 to 2025 except 2023, when it slipped from 10.0 to 9.9 times, and the 2025 median is 45% higher than in 2020 and 5% higher than in 2024.
- AGS measures adjusted EBITDA and Piper Sandler measures run-rate EBITDA, so the chart places two different earnings bases on one axis, and the gap between Piper Sandler's two size bands widened from 4.1 times EBITDA in 2018 to 8.5 times in 2024.
- A seller weighing an offer against a 2021 or 2022 benchmark is comparing it with a market that has since moved up by 1.6 to 2.6 times EBITDA.
The EBITDA Basis Can Nearly Triple a Quoted RIA Multiple
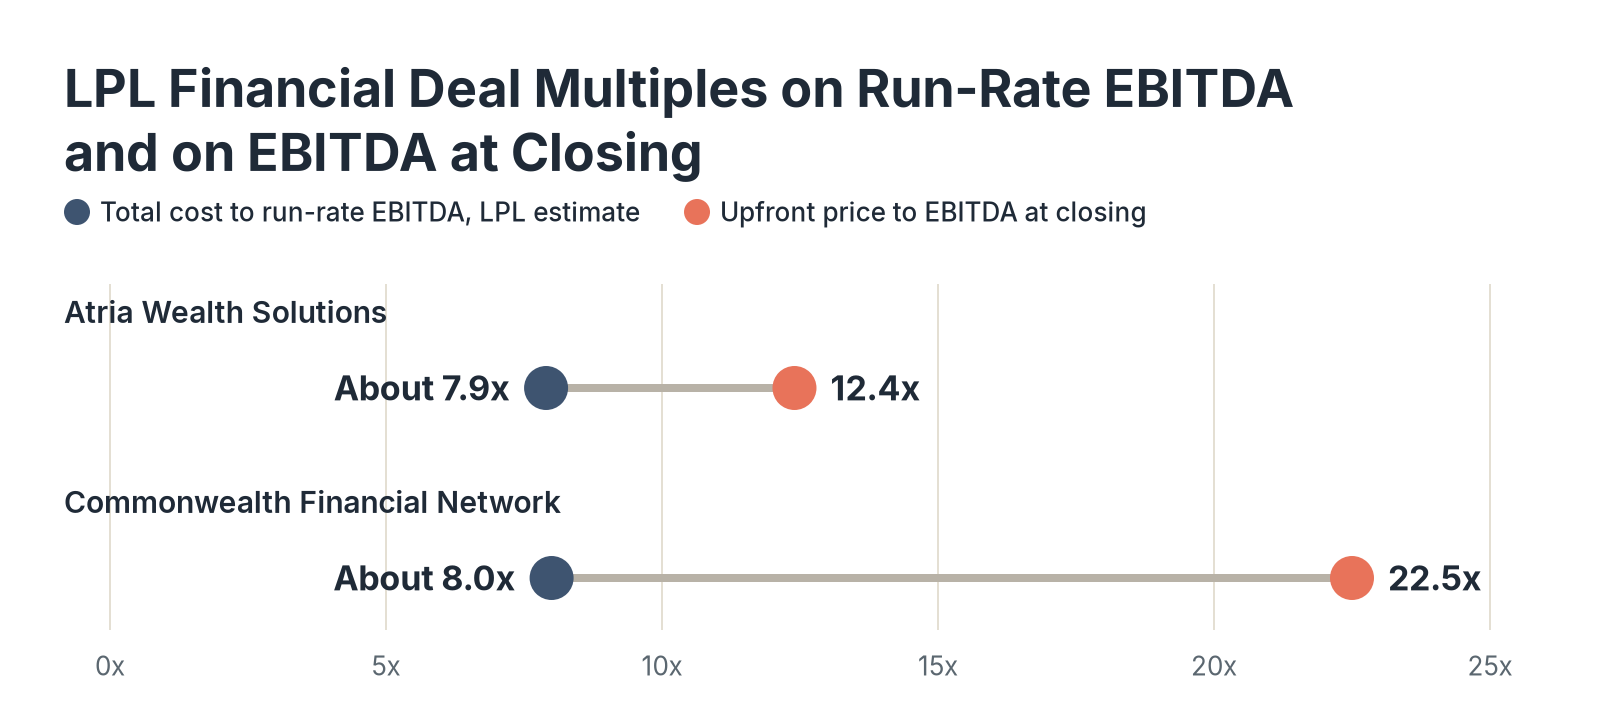
Most RIA deals are announced without a price, so the few with published terms are the best way to see how a buyer's choice of earnings changes the multiple it reports. Two LPL Financial acquisitions in our study disclose both the price and the EBITDA behind it.
| Announced | Buyer | Target | Price | EBITDA basis | Multiple, buyer figure | Multiple, EBITDA at closing |
|---|---|---|---|---|---|---|
| Feb 2024 | LPL Financial | Atria Wealth Solutions | About $805M upfront, plus up to about $230M earn-out | About $140M run-rate after integration; about $65M at closing | About 7.9x total cost to run-rate EBITDA (LPL) | 12.4x |
| Mar 2025 | LPL Financial | Commonwealth Financial Network | About $2.7B | About $415M run-rate after integration; about $120M at closing | About 8.0x total cost to run-rate EBITDA (LPL) | 22.5x |
Source: Fintech Index RIA Valuation Study (Source 1), from LPL Financial investor materials and SEC filings, 2024 and 2025 (Sources 7 and 8).
Data: deals_with_public_terms.csv
Key Findings
- LPL quotes both deals at about 8 times run-rate EBITDA, the earnings it expects once advisers move onto its platform and cost savings and added revenue arrive.
- On the EBITDA each firm brought at closing, the Commonwealth price is 22.5 times and the Atria price is 12.4 times, so Commonwealth cost 1.8 times as much per dollar of current earnings.
- Anyone comparing a deal with a published multiple should first ask which EBITDA it uses, because the same Commonwealth deal reads as about 8 times or 22.5 times.
RIA Deal Counts Set a Record in 2025 and Held Pace in 2026
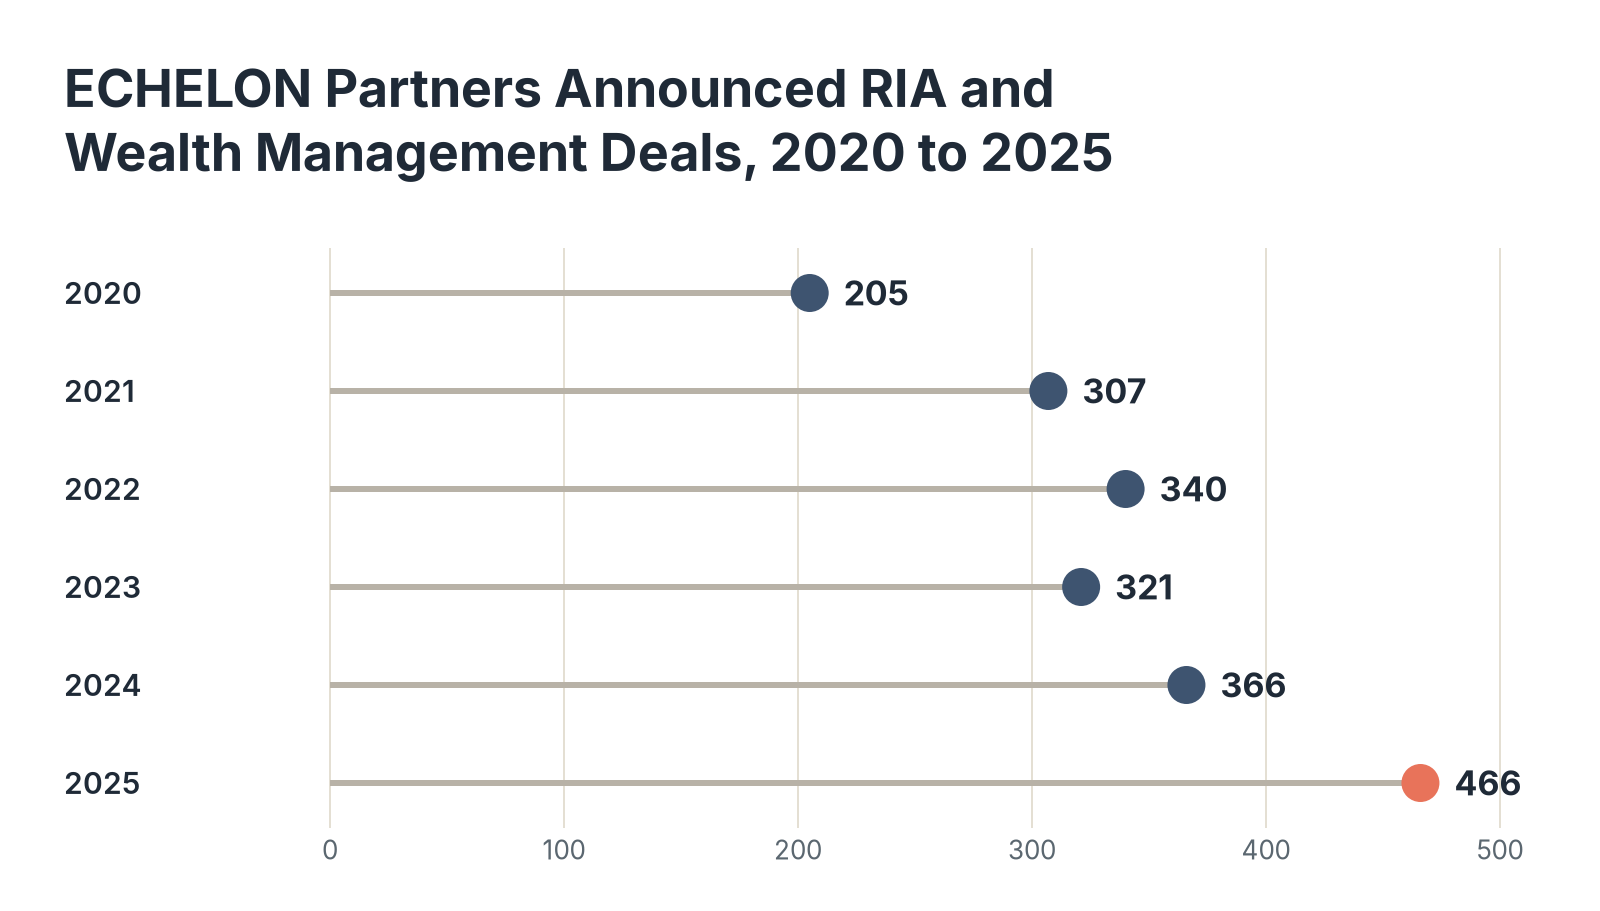
Multiples tell what buyers pay, and deal counts tell how busy the market is, which shapes how many bidders a seller can expect. ECHELON Partners, Piper Sandler, and DeVoe & Company each publish annual counts, and each counts deals differently: ECHELON Partners excludes deals involving $100 million or less in assets, and Piper Sandler counts all wealth management deals it tracks.
| Year | ECHELON Partners | Piper Sandler | DeVoe & Company |
|---|---|---|---|
| 2020 | 205 | 158 | n/a |
| 2021 | 307 | 255 | n/a |
| 2022 | 340 | 294 | n/a |
| 2023 | 321 | 284 | n/a |
| 2024 | 366 | 278 | 272 |
| 2025 | 466 | n/a | 322 |
| 2026, January to September | n/a | n/a | 244 |
Source: Fintech Index RIA Valuation Study (Source 1), from deal counts by ECHELON Partners, Piper Sandler, and DeVoe & Company, as reported by InvestmentNews on January 21 and October 15, 2026 (Sources 6, 9, 10, and 12).
Data: deal_counts_by_year.csv
Key Findings
- ECHELON Partners counted 466 deals in 2025, up 27.3% from 366 in 2024 and the highest of the six years shown.
- The publishers' counts for the same year differ because each uses its own definitions: in 2024, ECHELON Partners counted 366, Piper Sandler 278, and DeVoe & Company 272.
- DeVoe & Company counted 244 deals from January to September 2026, a pace of about 325 for the full year, so 2026 is on track to match the 322 deals it counted in 2025.
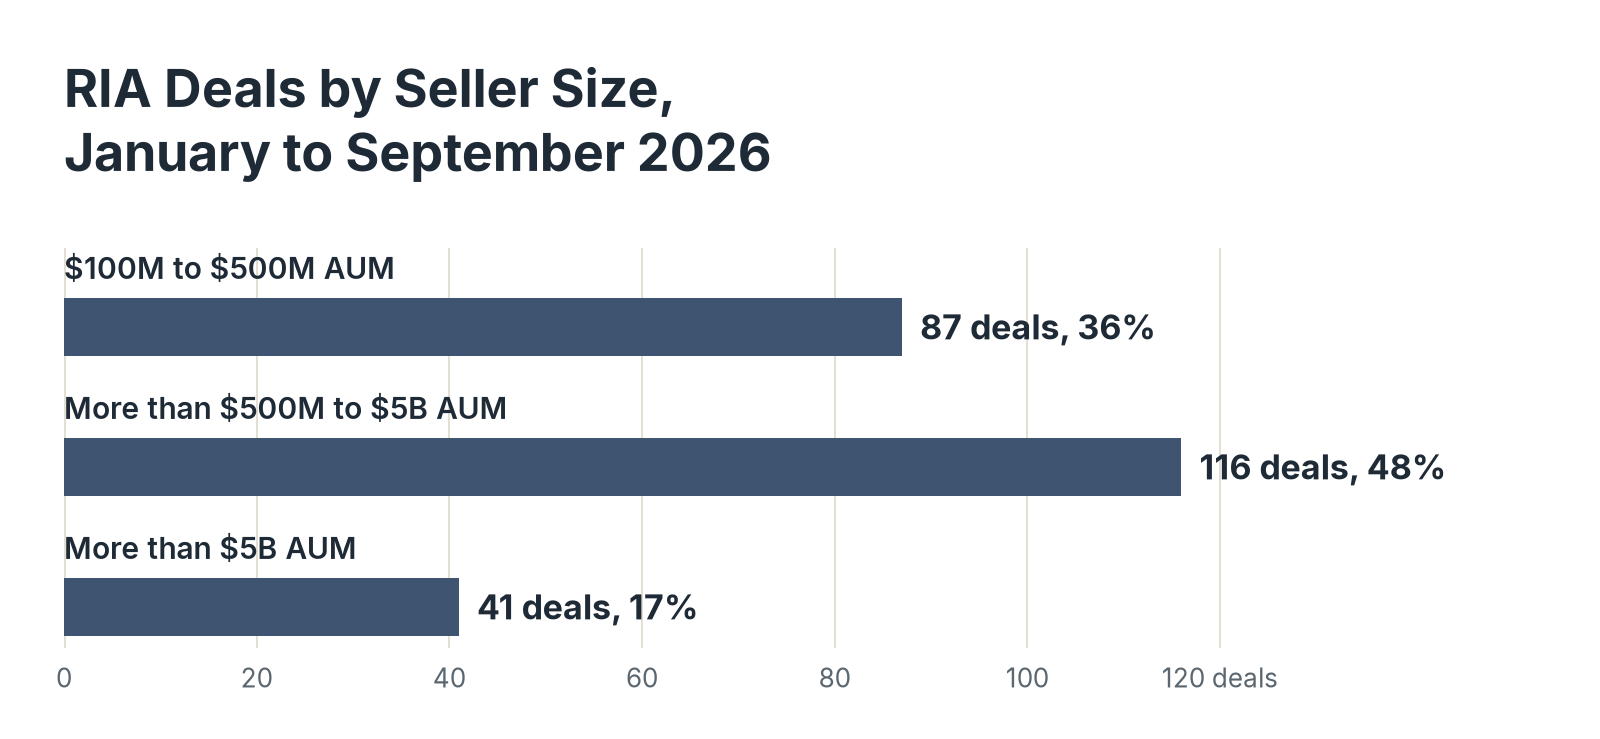
Most 2026 RIA Sellers Manage More Than $500M
We also wanted to know what kind of firms are selling in 2026, since a year with many large sellers pulls the published medians up. DeVoe & Company groups its January to September 2026 deals by the seller's assets under management (AUM).
| Seller AUM | Deals | Share of deals |
|---|---|---|
| $100M to $500M AUM | 87 | 36% |
| More than $500M to $5B AUM | 116 | 48% |
| More than $5B AUM | 41 | 17% |
| Total | 244 | 100% |
Source: Fintech Index RIA Valuation Study (Source 1), from DeVoe & Company seller size data for January to September 2026 (Sources 9 and 15).
Data: deals_by_seller_size_2026_ytd.csv
Key Findings
- Sellers with more than $500 million and up to $5 billion in assets accounted for 116 of the 244 deals (48%), the largest group.
- Firms with more than $5 billion completed 41 deals through September, already more than in any prior full year, while firms with $100 million to $500 million made up 36%, the smallest share DeVoe & Company has recorded.
- In DeVoe & Company's July 2026 survey of consolidators, 46% said they mainly target firms with $1 billion to $5 billion in assets and none mainly target firms under $500 million, so smaller sellers face fewer bidders.
Seller Size, Buyer Type, and EBITDA Basis Move an RIA Multiple
The tables above show how far multiples spread, and the publishers behind them also explain what pushes a single deal toward the top or bottom of that spread. DeVoe & Company, Advisor Growth Strategies, and Piper Sandler each describe those factors.
A published median describes only the deals its publisher collected. Steward Partners' chief operating officer told InvestmentNews on October 23, 2026, that deal terms are disclosed only for larger marquee deals and are not seen for some smaller deals or succession deals.
DeVoe & Company, as reported by WealthManagement.com in July 2026, says the highest-multiple deals typically involve firms managing tens or hundreds of billions of dollars in assets, with growth, profitability, and leadership that most sellers do not have.
Buyer type and fit also move the price. In an AGS case study reported by WealthManagement.com, firms with non-ideal attributes drew a 21% discount from better-positioned peers. DeVoe & Company also reports that internal succession deals anchor the low end of valuations, that strategic RIA acquirers pay materially more, and that private-equity-backed consolidators typically pay the highest valuations when sellers hire investment bankers to run competitive processes.
Piper Sandler counts more than 50 active private-equity-backed wealth platforms, compared with fewer than 10 in 2019, and these platforms completed 186 of the 278 wealth management deals it tracked in 2024. It put the 2024 median for all wealth management deals involving sellers with more than $1 billion in assets at 17.0 times run-rate EBITDA.
What RIA Valuation Multiples Mean for Sellers and Buyers in 2026
The headline multiples in RIA deals come mostly from large sellers, private-equity-backed buyers, and run-rate earnings, while most firms that sell are smaller and close without a published price. The median rose to 11.6 times adjusted EBITDA in 2025, firms above $5 billion sold for about 21 times run-rate EBITDA, and the gap between large and small sellers has roughly doubled since 2018.
Buyers expect the level to hold rather than climb. In DeVoe & Company's July 2026 survey of 40 consolidator executives, 82% expected valuations to stay stable in the second half of 2026, 18% expected declines, and none expected increases, and AGS expects the gap between average and premium valuations to keep widening. DeVoe & Company also warns that higher borrowing costs are testing what debt-funded buyers can pay, which may push more of the price into seller financing and payments tied to future results.
So if you are weighing an offer for an RIA, compare it only with multiples from firms of a similar size, from the last year or two, and measured on the same kind of EBITDA.
Data Collection and Methodology
We reviewed RIA and wealth management valuation figures from published industry reports, SEC filings, and company announcements, collected in October 2026. Multiples are prices paid in private acquisitions of RIAs and wealth management firms; public-market trading multiples are not included. All prices are in US dollars as published, so no currency conversion was needed.
Terms. RIAs are independent wealth management firms that mostly charge clients a yearly fee tied to assets under management (AUM). A multiple is the price paid divided by earnings before interest, taxes, depreciation, and amortization (EBITDA). Piper Sandler and LPL Financial use run-rate EBITDA, a firm's earnings projected over a full year after integration, and Advisor Growth Strategies (AGS) uses adjusted EBITDA, which removes one-time expenses, non-operating expenses, and synergies. An earn-out is an extra payment that depends on how much client money stays after closing.
Table notes. The 2,249 announced deals are ECHELON Partners' 2,005 for 2020 through 2025 plus DeVoe & Company's 244 for January to September 2026. The periods do not overlap, and other publishers' counts for the same years appear in separate columns and are not added. Piper Sandler reports one median for all sellers under $5B in AUM and two ranges for each size band, and we show both. AGS medians come from its own data set, 41 transactions in 2023 and 60 in 2025. LPL's multiples divide total cost, the upfront price plus onboarding and integration costs, and for Commonwealth technology costs, by run-rate EBITDA, and the closing multiples divide the upfront price by the EBITDA LPL expected to acquire at closing, excluding earn-outs. For the 2026 deals by seller size, the middle row is the total less the two outer rows, and the shares sum to 101% because of rounding. The full-year 2026 pace is the January to September count divided by nine and multiplied by twelve.
Multiples are shown as reported, rounded to one decimal place where the source gives one. We calculated products, differences, and ratios from the published values.
Sources
- Fintech Index RIA Valuation Study: analysis of 2,249 announced RIA and wealth management transactions from 2020 to September 2026, published median multiples from 2018 to 2025, and LPL Financial deal terms, conducted October 2026
- Advisor Growth Strategies, The RIA Deal Room: Life After the Gold Rush, 2024
- Advisor Growth Strategies via PR Newswire, RIA M&A Valuations Set New High-Water Mark With Pressure Building on Middle-Market RIAs, March 25, 2026
- WealthManagement.com, RIA Valuation Metric Hits Near-Decade High, March 31, 2025
- WealthManagement.com, RIA Valuations Hit New Record in 2025, March 25, 2026
- Piper Sandler, Steady as She Goes: 2024 Asset & Wealth Management Transaction Review and 2025 Forecast, March 2025
- LPL Financial, LPL Financial to Acquire Atria Wealth Solutions, February 13, 2024
- LPL Financial, LPL Financial to Acquire Commonwealth Financial Network, Form 8-K Exhibit 99.2, March 31, 2025
- InvestmentNews, RIA M&A drops 17% in Q3 as mega sellers set new record, DeVoe says, October 15, 2026
- ECHELON Partners, The 2025 ECHELON RIA M&A Deal Report, February 2026
- WealthManagement.com, RIA Buyers Predict Valuations to Flatline in Second Half of 2026, July 16, 2026
- InvestmentNews, RIA M&A smashes deal record in 2025 despite shrinking buyer pool, January 21, 2026
- LPL Financial, LPL Financial to Acquire Commonwealth Financial Network, March 31, 2025
- InvestmentNews, RIA M&A runs up to 5x reported totals, Steward Partners CEO says, October 23, 2026
- DeVoe & Company, Q3 2026 DeVoe RIA Deal Book, October 15, 2026