Payment Take Rate Benchmarks: 2026 Report
How much of each payment does a payment company keep? We divided each publicly traded company's revenue by the payment volume it reports in its filings.

Each time a shopper pays by card, through PayPal or with a buy now, pay later plan, the companies that move the money each keep a small share of the payment. That share is the company's take rate, so a company that keeps $2 of every $100 it handles has a take rate of 2%. Some kinds of payment companies keep a much bigger share than others, so we compared them.
Our analysts studied payment take rates at 19 publicly traded payment companies, from card networks and merchant processors to money transfer services and buy now, pay later lenders. We collected revenue and payment volume for each on October 7, 2026, from its most recent annual report, 10-K or 20-F filing, or year-end earnings release, and divided revenue by volume.
Payment Take Rates by Company
Companies are sorted from the highest take rate to the lowest.
| Company | Business Type | Fiscal Year | Revenue Line Used | Revenue | Payment Volume | Take Rate |
|---|---|---|---|---|---|---|
| Sezzle | Buy now, pay later | 2025 | Total revenue | $450.3M | $3.94B | 11.43% |
| Affirm | Buy now, pay later | Ended June 2026 | Total revenue | $4,261.1M | $50.2B | 8.49% |
| Global-e | Cross-border and remittance | 2025 | Service fees revenue | $451.2M | $6.57B | 6.87% |
| Klarna | Buy now, pay later | 2025 | Total revenue | $3,509M | $127.9B | 2.74% |
| dLocal | Cross-border and remittance | 2025 | Revenue | $1,093.6M | $40.8B | 2.68% |
| Toast | Merchant acquiring and processing | 2025 | Financial technology solutions revenue | $5,037M | $195.1B | 2.58% |
| StoneCo | Merchant acquiring and processing | 2025 | Total revenue and income | R$14,153.8M | R$560.9B | 2.52% |
| Remitly | Cross-border and remittance | 2025 | Revenue | $1,635.1M | $74.9B | 2.18% |
| Shift4 | Merchant acquiring and processing | 2025 | Gross revenue | $4,180M | $209B | 2.00% |
| PayPal | Digital wallet and checkout | 2025 | Net revenues | $33,172M | $1,794.0B | 1.85% |
| Flywire | Cross-border and remittance | 2025 | Revenue | $623.0M | $37.6B | 1.66% |
| Payoneer | Cross-border and remittance | 2025 | Revenue | $1,052.8M | $87.5B | 1.20% |
| Paysafe | Merchant acquiring and processing | 2025 | Total revenue | $1,701.4M | $167B | 1.02% |
| Wise | Cross-border and remittance | Ended March 2026 | Cross-border revenue | $1,257.0M | $243.5B | 0.52% |
| BILL | B2B payables and receivables | Ended June 2026 | Total revenue | $1,653.2M | $371.3B | 0.45% |
| Mastercard | Card network | 2025 | Net revenue | $32,791M | $10.6T | 0.31% |
| Visa | Card network | Ended Sept. 2025 | Net revenue | $40,000M | $13.89T | 0.29% |
| Adyen | Merchant acquiring and processing | 2025 | Net revenue | €2,364.2M | €1,394.3B | 0.17% |
| Marqeta | Card issuing platform | 2025 | Net revenue | $624.9M | $382.5B | 0.16% |
Fiscal years: Affirm and BILL ended June 30, 2026; Wise ended March 31, 2026; Visa ended September 30, 2025; all others are calendar 2025. Block and MercadoLibre are excluded because neither reports payment processing revenue separately.
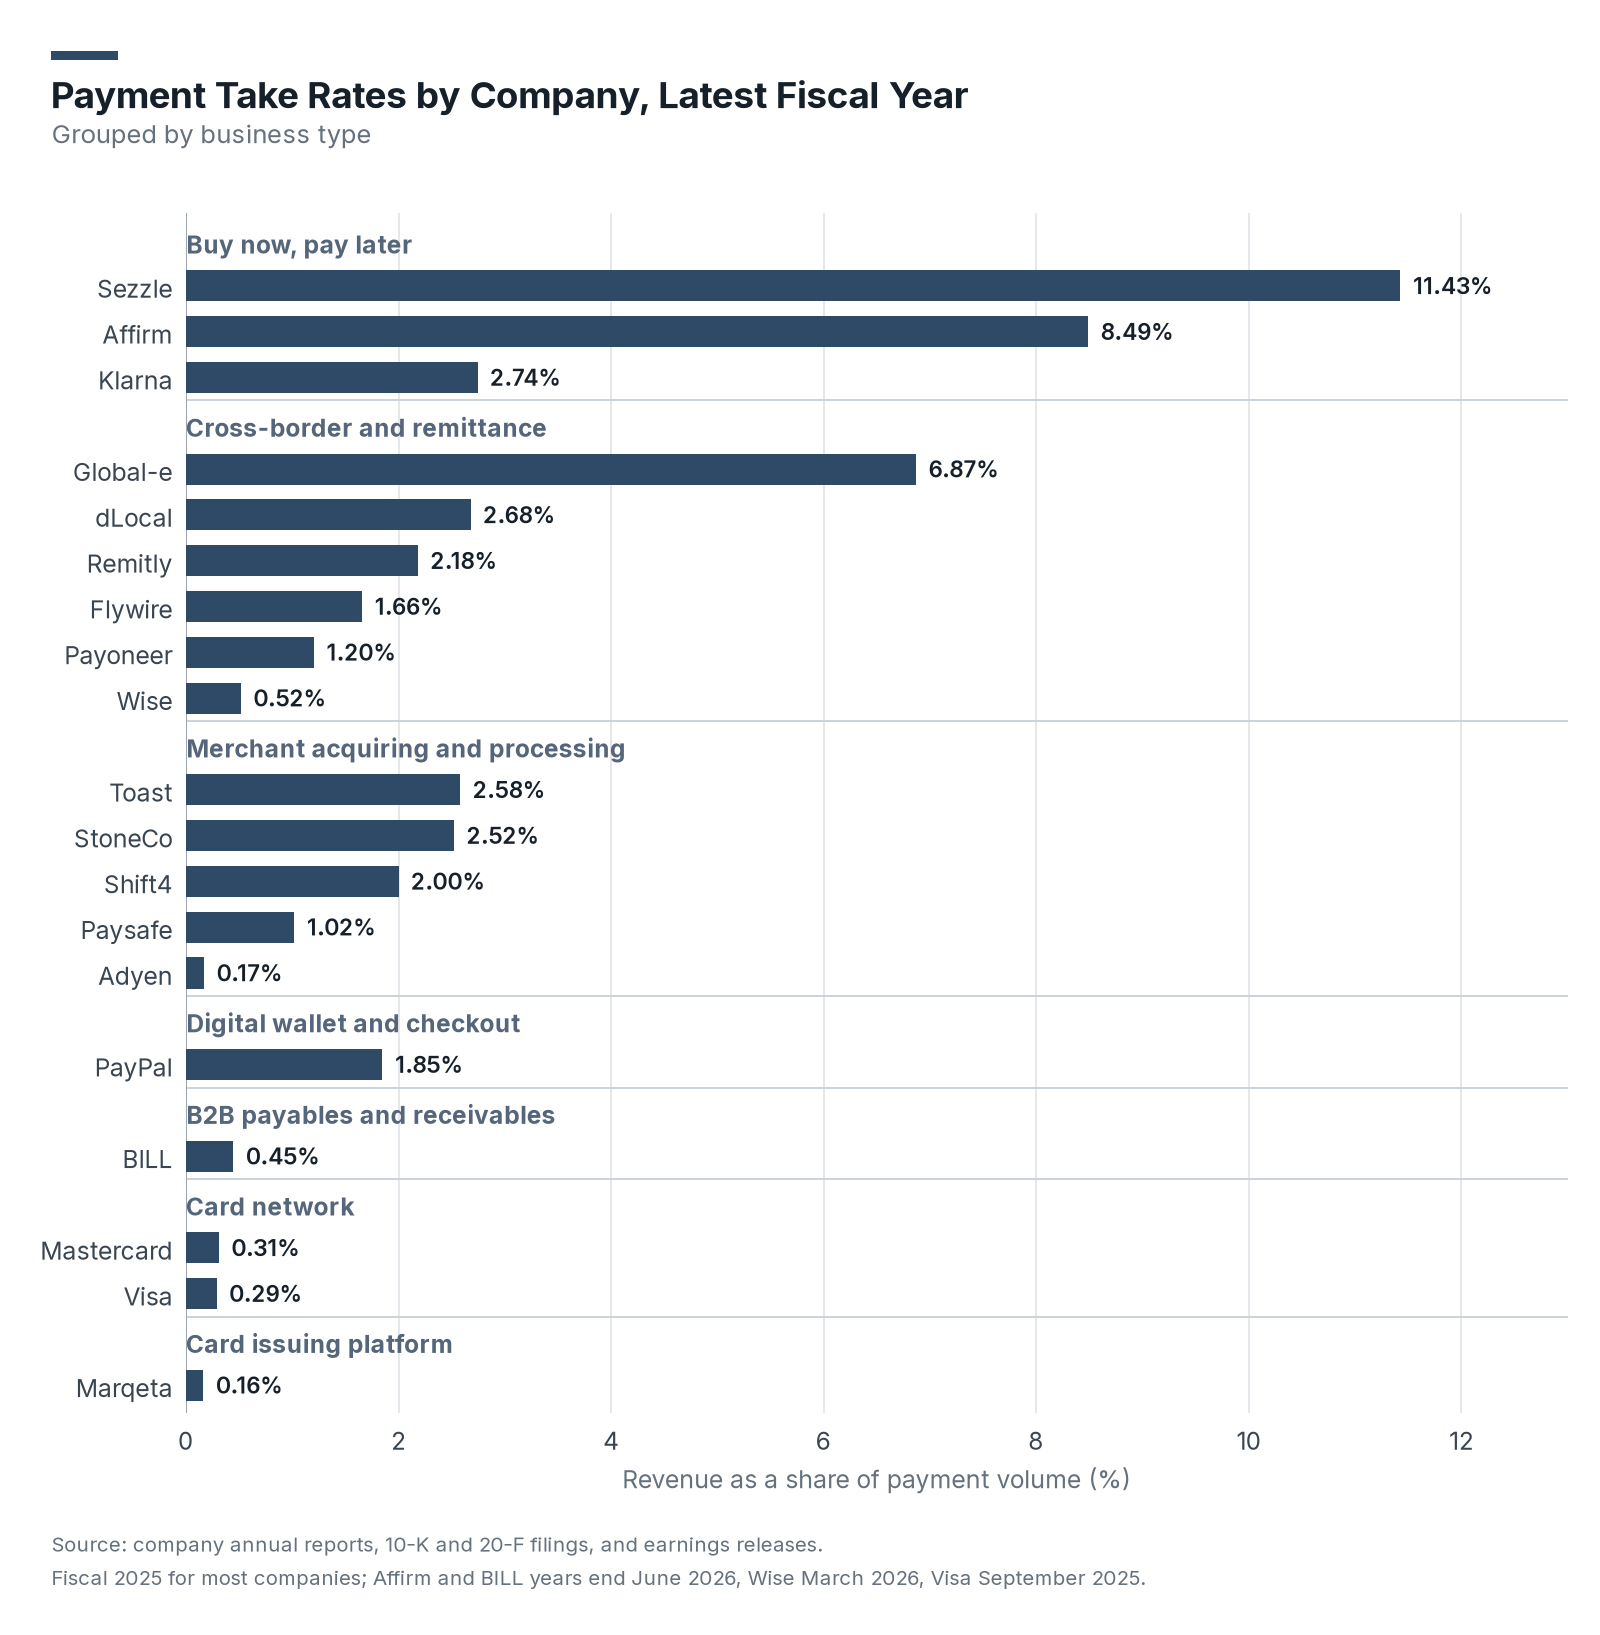
- The median take rate across the 19 companies is 1.85%, which is PayPal's rate. The range runs from 0.16% at Marqeta, a card issuing platform, to 11.43% at Sezzle.
- Affirm, Klarna and Sezzle earn revenue from shoppers as well as merchants. Interest income on loans was $2,047.5 million at Affirm, or 48% of its fiscal 2026 revenue, and $937 million at Klarna, or 27% of its 2025 revenue.
- The price of accepting payments varies widely by provider. Take rates run from 0.16% at Marqeta to 11.43% at Sezzle, with a 1.85% median. Card networks keep only about 0.3%, so most of what merchants pay goes to processors, lenders and issuers.
Median Payment Take Rate by Business Type
| Business Type | Companies | Median Take Rate | Lowest | Highest |
|---|---|---|---|---|
| Buy now, pay later | 3 | 8.49% | 2.74% (Klarna) | 11.43% (Sezzle) |
| Merchant acquiring and processing | 5 | 2.00% | 0.17% (Adyen) | 2.58% (Toast) |
| Cross-border and remittance | 6 | 1.92% | 0.52% (Wise) | 6.87% (Global-e) |
| Digital wallet and checkout | 1 | 1.85% | 1.85% (PayPal) | 1.85% (PayPal) |
| B2B payables and receivables | 1 | 0.45% | 0.45% (BILL) | 0.45% (BILL) |
| Card network | 2 | 0.30% | 0.29% (Visa) | 0.31% (Mastercard) |
| Card issuing platform | 1 | 0.16% | 0.16% (Marqeta) | 0.16% (Marqeta) |
- The median buy now, pay later take rate of 8.49% is more than four times the 1.85% median for all 19 companies.
- BNPL is by far the costliest way for merchants to accept payment. The BNPL median of 8.49% is more than four times the overall median, and 16 non-BNPL companies sit at 1.43%.
- Excluding the three buy now, pay later lenders, the median take rate for the other 16 companies is 1.43%.
Payment Take Rates Before and After Processing Costs
Payment companies with similar businesses can show very different take rates because some record the full fee a merchant pays as revenue, while others report revenue after the card network and bank fees they pass on. Shift4 and PayPal disclose both figures.
| Company | Reported Revenue | Take Rate on Reported Revenue | Costs Deducted | Revenue After Those Costs | Take Rate After Those Costs |
|---|---|---|---|---|---|
| Shift4 | $4,180M | 2.00% | Network fees of $2,199M | $1,981M | 0.95% |
| PayPal | $33,172M | 1.85% | Transaction expense and transaction and credit losses | $15,465M | 0.86% |
- Shift4's network fees of $2,199 million equaled 1.05% of its $209 billion in payment volume, more than half of its gross revenue. Shift4 uses gross revenue less network fees as a key performance measure.
- PayPal's transaction expense, which its 10-K describes as fees paid to processors and other financial institutions when PayPal draws funds from a customer's card or bank account, was $15,987 million in 2025. That was 0.89% of total payment volume, down from 0.93% in 2024, which PayPal attributes mainly to a smaller share of volume from its Braintree products. The $15,465 million in the table is PayPal's transaction margin dollars.
- Headline take rates overstate what many processors keep. Shift4's network fees equaled 1.05% of volume, more than half its gross revenue, and PayPal's transaction expense was 0.89%.
Change in Payment Take Rates, Prior Year to Latest Fiscal Year
Paysafe is not in this table because its results release gives no prior-year volume figure. A basis point is one hundredth of a percentage point.
| Company | Prior-Year Take Rate | Latest Take Rate | Change (Basis Points) | Volume Growth | Revenue Growth |
|---|---|---|---|---|---|
| Global-e | 7.21% | 6.87% | -34.3 | 35.2% | 28.8% |
| Affirm | 8.79% | 8.49% | -29.8 | 36.8% | 32.2% |
| dLocal | 2.92% | 2.68% | -23.8 | 59.6% | 46.6% |
| Remitly | 2.31% | 2.18% | -13.2 | 37.2% | 29.4% |
| Wise | 0.58% | 0.52% | -6.2 | 31.5% | 17.3% |
| PayPal | 1.89% | 1.85% | -4.2 | 6.7% | 4.3% |
| Shift4 | 2.02% | 2.00% | -1.9 | 26.7% | 25.5% |
| Payoneer | 1.22% | 1.20% | -1.7 | 9.2% | 7.7% |
| Marqeta | 0.17% | 0.16% | -1.1 | 31.4% | 23.3% |
| Flywire | 1.66% | 1.66% | 0.0 | 26.6% | 26.6% |
| BILL | 0.44% | 0.45% | +0.2 | 12.6% | 13.0% |
| Visa | 0.28% | 0.29% | +1.1 | 7.0% | 11.3% |
| Adyen | 0.16% | 0.17% | +1.4 | 8.4% | 18.4% |
| Mastercard | 0.29% | 0.31% | +2.2 | 8.2% | 16.4% |
| Toast | 2.55% | 2.58% | +3.4 | 22.6% | 24.3% |
| Klarna | 2.68% | 2.74% | +6.8 | 21.8% | 24.8% |
| StoneCo | 2.33% | 2.52% | +18.9 | 8.7% | 17.5% |
| Sezzle | 10.67% | 11.43% | +75.4 | 55.1% | 66.1% |
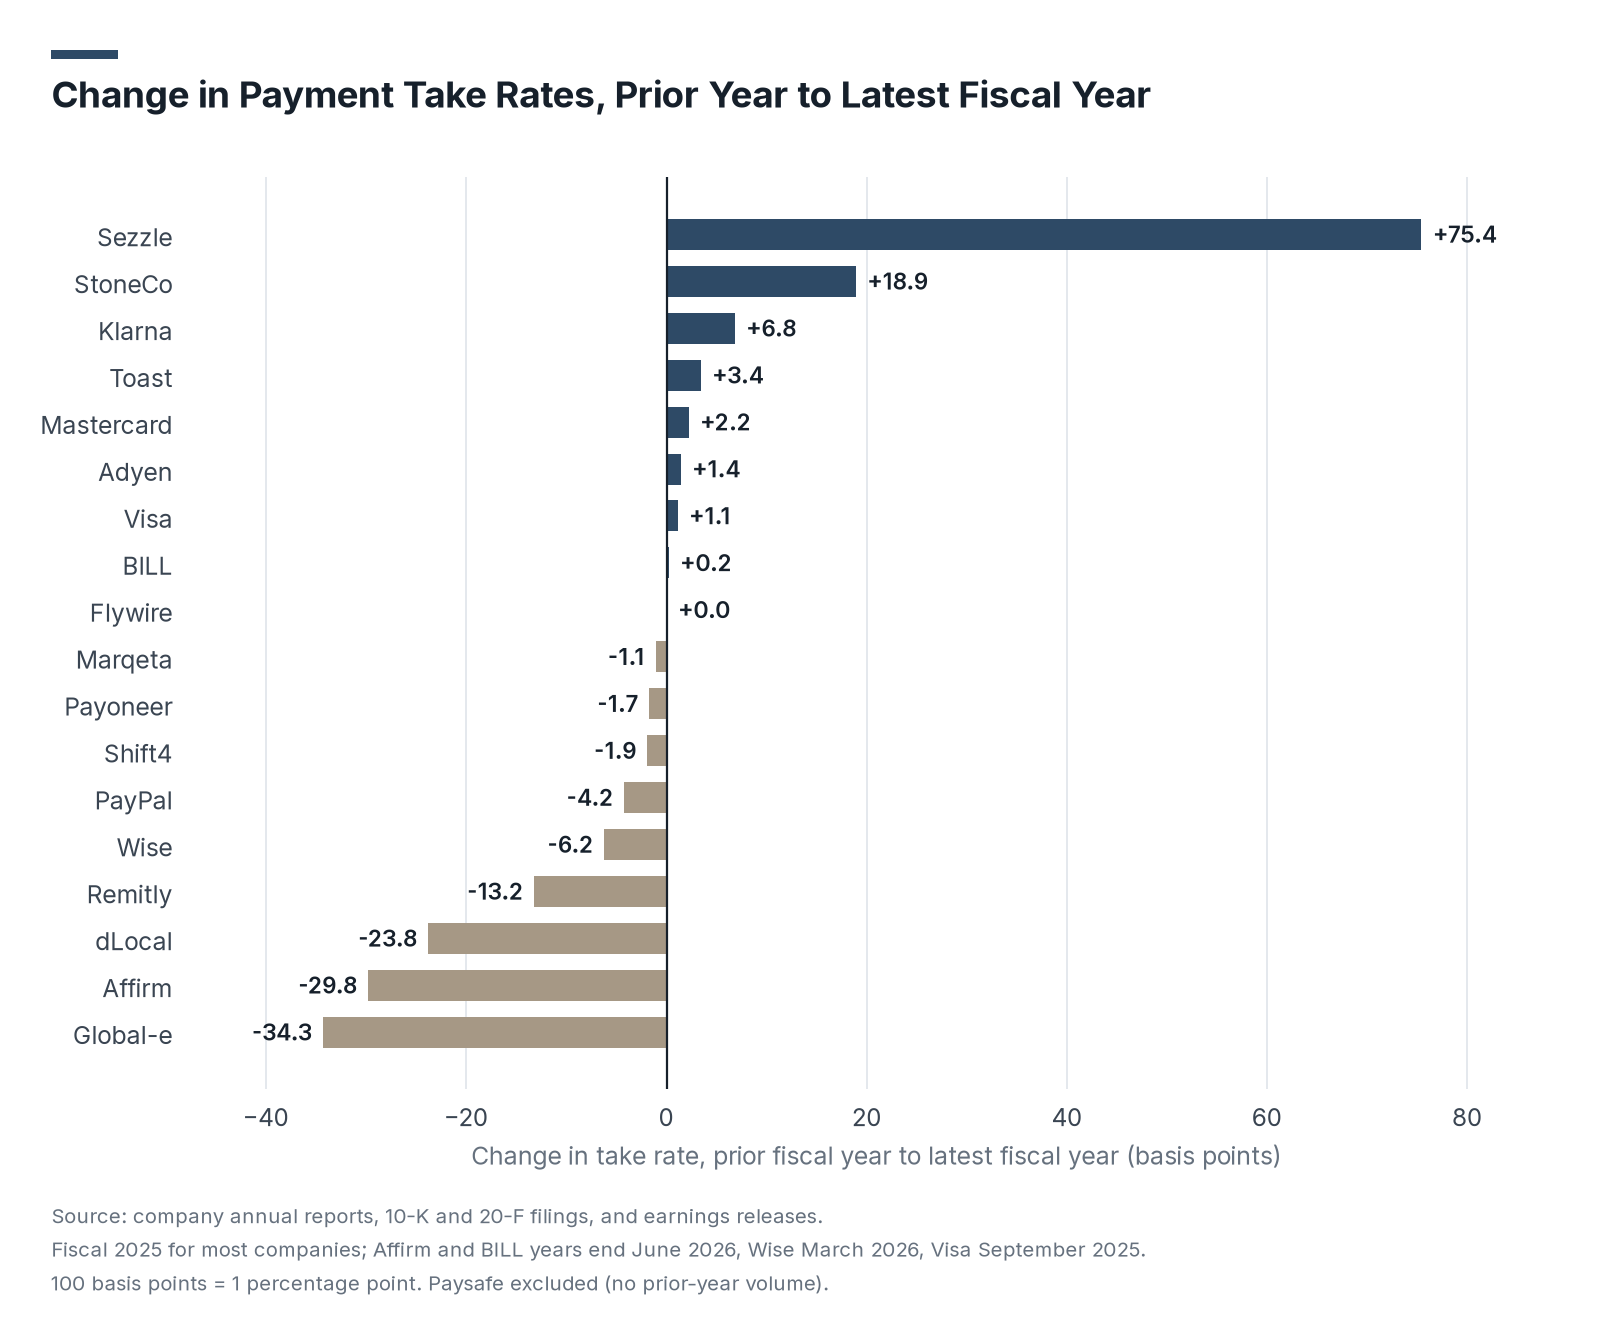
- Nine of the 18 companies had a lower take rate in their latest fiscal year, eight had a higher one, and Flywire's stayed at 1.66% because its revenue and volume both grew 26.6%.
- Affirm's fiscal 2026 10-K reports that its merchant network revenue fell from 2.4% to 2.3% of gross merchandise volume (GMV) while GMV from 0% APR loans grew 48%. dLocal's year-end release linked a fall in fourth-quarter gross profit as a share of volume to growth with established merchants and expansion into new payment methods, products and countries.
- Take rates are under mixed pressure. Nine of 18 companies saw rates fall and eight saw them rise, often through repricing or new consumer fees.
Payment Volume Growth and Revenue Growth
A company below the dashed line grew revenue more slowly than volume, so its take rate fell.
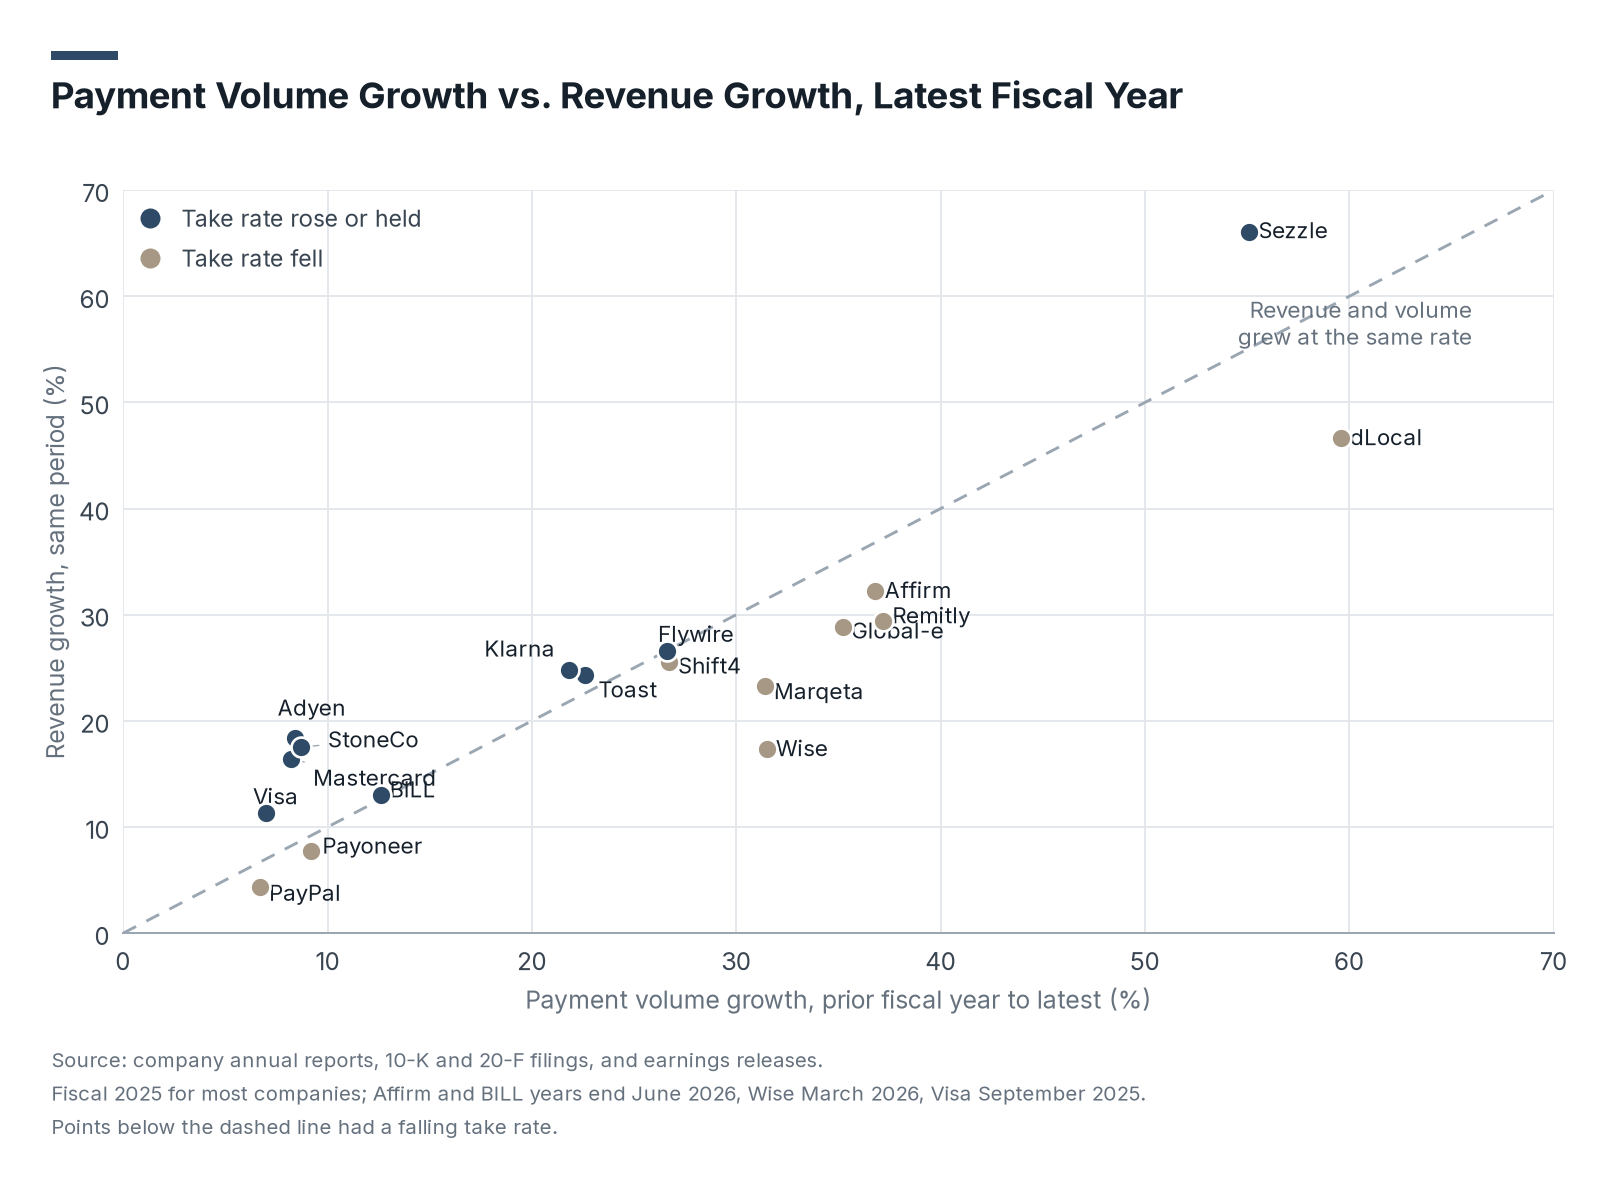
- Seven companies grew payment volume by more than 30%, and six of them grew revenue more slowly: dLocal, Remitly, Affirm, Global-e, Wise and Marqeta. Wise had the widest gap, with cross-border volume up 31.5% and cross-border revenue up 17.3%. Sezzle was the exception, with volume up 55.1% and revenue up 66.1%.
- Six companies grew volume by less than 10%. Visa, Mastercard, Adyen and StoneCo grew revenue faster than volume, while PayPal and Payoneer grew revenue more slowly.
- Adyen's processed volume rose 8.4%, while net revenue grew 18%. Adyen's release says volume grew 21% when a single large-volume customer is excluded.
What Payment Take Rate Trends Mean for 2027 and Beyond
What a merchant pays to accept a payment depends mostly on the kind of provider in the middle. Card networks keep only a small slice, processors, lenders and issuers keep most of it, and buy now, pay later costs several times what other methods do. Over time, those fees feed into the prices shoppers pay at checkout.
The fastest-growing payment companies are keeping less of each payment as they grow, which means more of their growth comes from volume priced at lower rates. That gives merchants more room to push for lower fees when their contracts come up for renewal, and the providers that cannot cut their own costs feel that pressure first.
So if you're a merchant offering buy now, pay later, check that it brings in enough extra sales to cover its higher fee.
Data Collection and Methodology
A company was included if it is publicly traded and reports both annual revenue and an annual payment volume figure for the same period. We used total revenue in all but three cases, where the company reports a separate revenue line for the business that produces the volume: financial technology solutions revenue at Toast, cross-border revenue at Wise, and service fees at Global-e.
Several companies publish a take rate or a similar ratio of their own. Those figures can differ from the take rates above, which use total or segment revenue.
| Company | Company's Measure | Company Figure | Rate in This Report |
|---|---|---|---|
| Wise | Cross-border take rate | 0.52% | 0.52% |
| Payoneer | Revenue as a % of volume | 1.20% | 1.20% |
| Sezzle | Total revenue as a % of GMV | 11.4% | 11.43% |
| Affirm | Merchant network revenue as a % of GMV | 2.3% | 8.49% |
| dLocal | Net take rate, defined as gross profit divided by TPV | 0.88% (fourth quarter 2025) | 2.68% |
- Affirm's merchant network revenue covers only what merchants pay. Its total revenue also includes card network revenue, interest income, gains on loan sales and servicing income, which together bring its rate to 8.49%.
- dLocal calls gross profit divided by payment volume its net take rate. On that basis its fourth-quarter 2025 figure was 0.88%, down from 1.09% a year earlier.
Sources
- Fintech Index, Payment Take Rate Study: analysis of 19 publicly traded payment companies' 2025 and 2026 annual filings and earnings releases, conducted October 2026.
- PayPal fourth quarter and full year 2025 results. PayPal Holdings, Form 8-K, February 3, 2026.
- PayPal annual report for 2025. PayPal Holdings, Form 10-K, February 3, 2026.
- Visa annual report for fiscal 2025. Visa, Form 10-K, November 6, 2025. Payments volume is for the 12 months ended June 30, the basis Visa uses for service revenue.
- Mastercard fourth quarter and full year 2025 results. Mastercard, Form 8-K, January 29, 2026.
- Mastercard fourth quarter and full year 2024 results. Mastercard, Form 8-K, January 30, 2025.
- Mastercard annual report for 2025. Mastercard, Form 10-K, February 11, 2026.
- Adyen publishes H2 2025 financial results. Adyen, February 12, 2026.
- Adyen publishes H2 2024 financial results. Adyen, February 13, 2025.
- Shift4 annual report for 2025. Shift4 Payments, Form 10-K, February 27, 2026.
- Toast fourth quarter and full year 2025 results. Toast, Form 8-K, February 12, 2026.
- Toast annual report for 2025. Toast, Form 10-K, February 18, 2026.
- StoneCo fourth quarter and full year 2025 earnings release. StoneCo, Form 6-K, March 2, 2026.
- Paysafe fourth quarter and full year 2025 results. Paysafe, Form 6-K, March 3, 2026.
- Wise Group full year 2026 financial results. Wise Group, Form 6-K exhibit, June 25, 2026.
- Remitly fourth quarter and full year 2025 results. Remitly Global, Form 8-K, February 18, 2026.
- Flywire annual report for 2025. Flywire, Form 10-K, February 24, 2026.
- dLocal fourth quarter and full year 2025 results. dLocal, Form 6-K, March 18, 2026.
- dLocal fourth quarter 2025 earnings presentation. dLocal, Form 6-K, March 18, 2026.
- Payoneer fourth quarter and full year 2025 results. Payoneer Global, Form 8-K, February 26, 2026.
- Global-e fourth quarter and full year 2025 results. Global-E Online, Form 6-K, February 18, 2026.
- Affirm annual report for fiscal 2026. Affirm Holdings, Form 10-K, August 27, 2026. Prior-year GMV of $36.7 billion is calculated from the 10-K's fiscal 2026 GMV of $50.2 billion and its reported increase of $13.5 billion.
- Klarna annual report for 2025. Klarna Group, Form 20-F, February 26, 2026.
- Sezzle annual report for 2025. Sezzle, Form 10-K, February 26, 2026.
- Sezzle fourth quarter and full year 2025 results. Sezzle, Form 8-K, February 25, 2026.
- Marqeta fourth quarter and full year 2025 results. Marqeta, Form 8-K, February 24, 2026.
- BILL fourth quarter fiscal 2026 results. BILL Holdings, Form 8-K, August 19, 2026. Annual payment volume is the sum of the four quarterly figures in the release.
- Block annual report for 2025. Block, Form 10-K, February 26, 2026. Used for the reason Block is excluded.
- MercadoLibre annual report for 2025. MercadoLibre, Form 10-K, February 25, 2026. Used for the reason MercadoLibre is excluded.