Payment Orchestration Approval Rate Statistics: 2026 Report

Our analysts reviewed a 2026 survey of 110 US companies on how they route card payments, the authorization results that payment providers report for their own routing and token products, and the orchestration and vault products in our reviews of 173 rated companies, as of Q4 2026. We charted approval rates by orchestration capability tier, the routing practices companies use today, and the uplifts that four providers report.
Payment orchestration is a layer that connects a merchant to more than one payment provider and decides where each payment goes, so a decline or an outage at one provider does not have to end the sale.
Key Findings
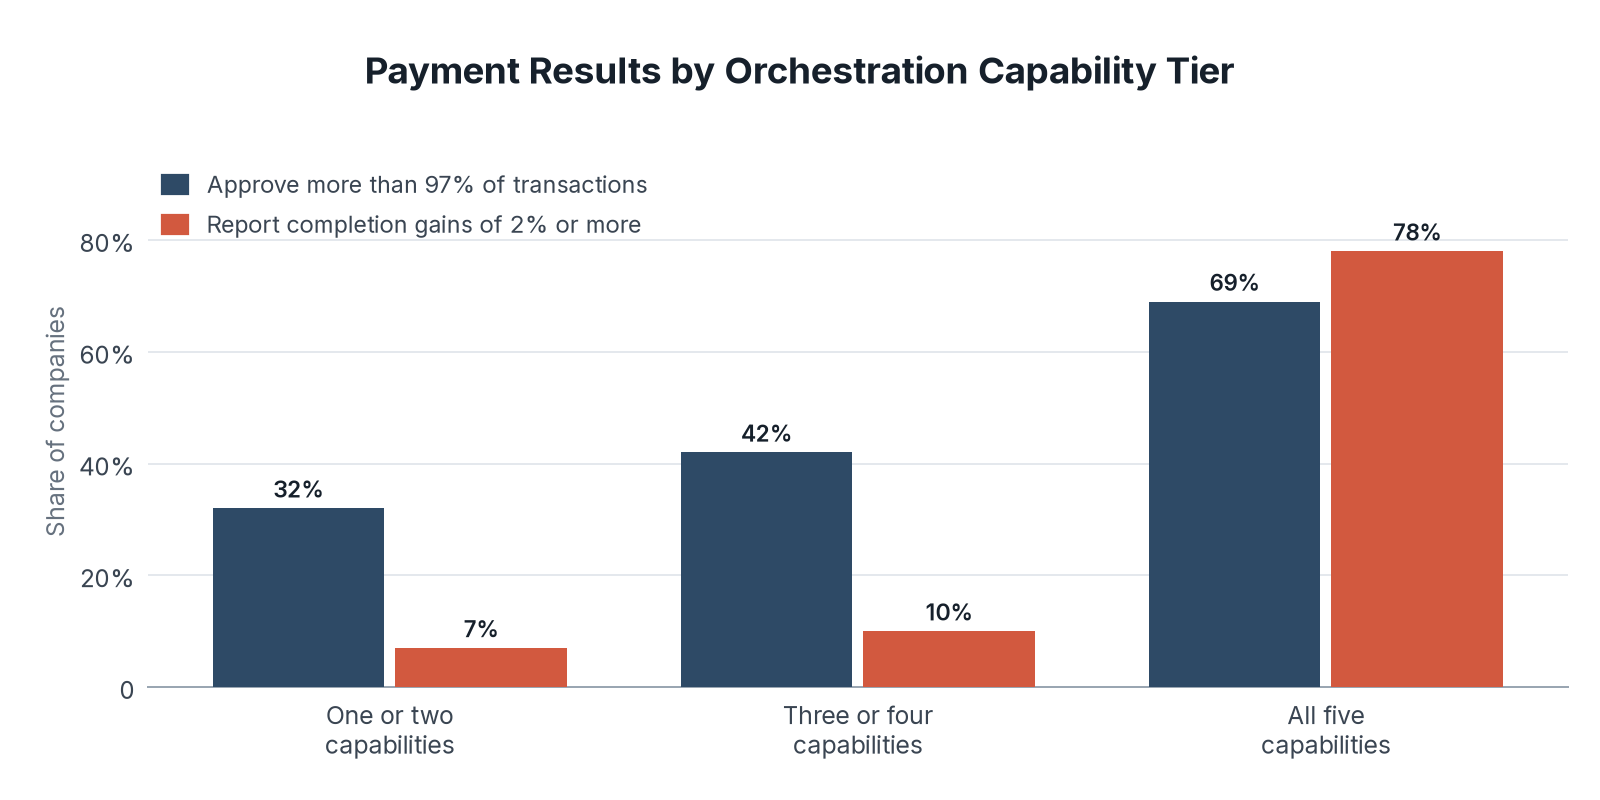
- 69% of companies with all five core orchestration capabilities approve more than 97% of transactions in a typical month, compared with 32% of companies with one or two capabilities and 42% with three or four.
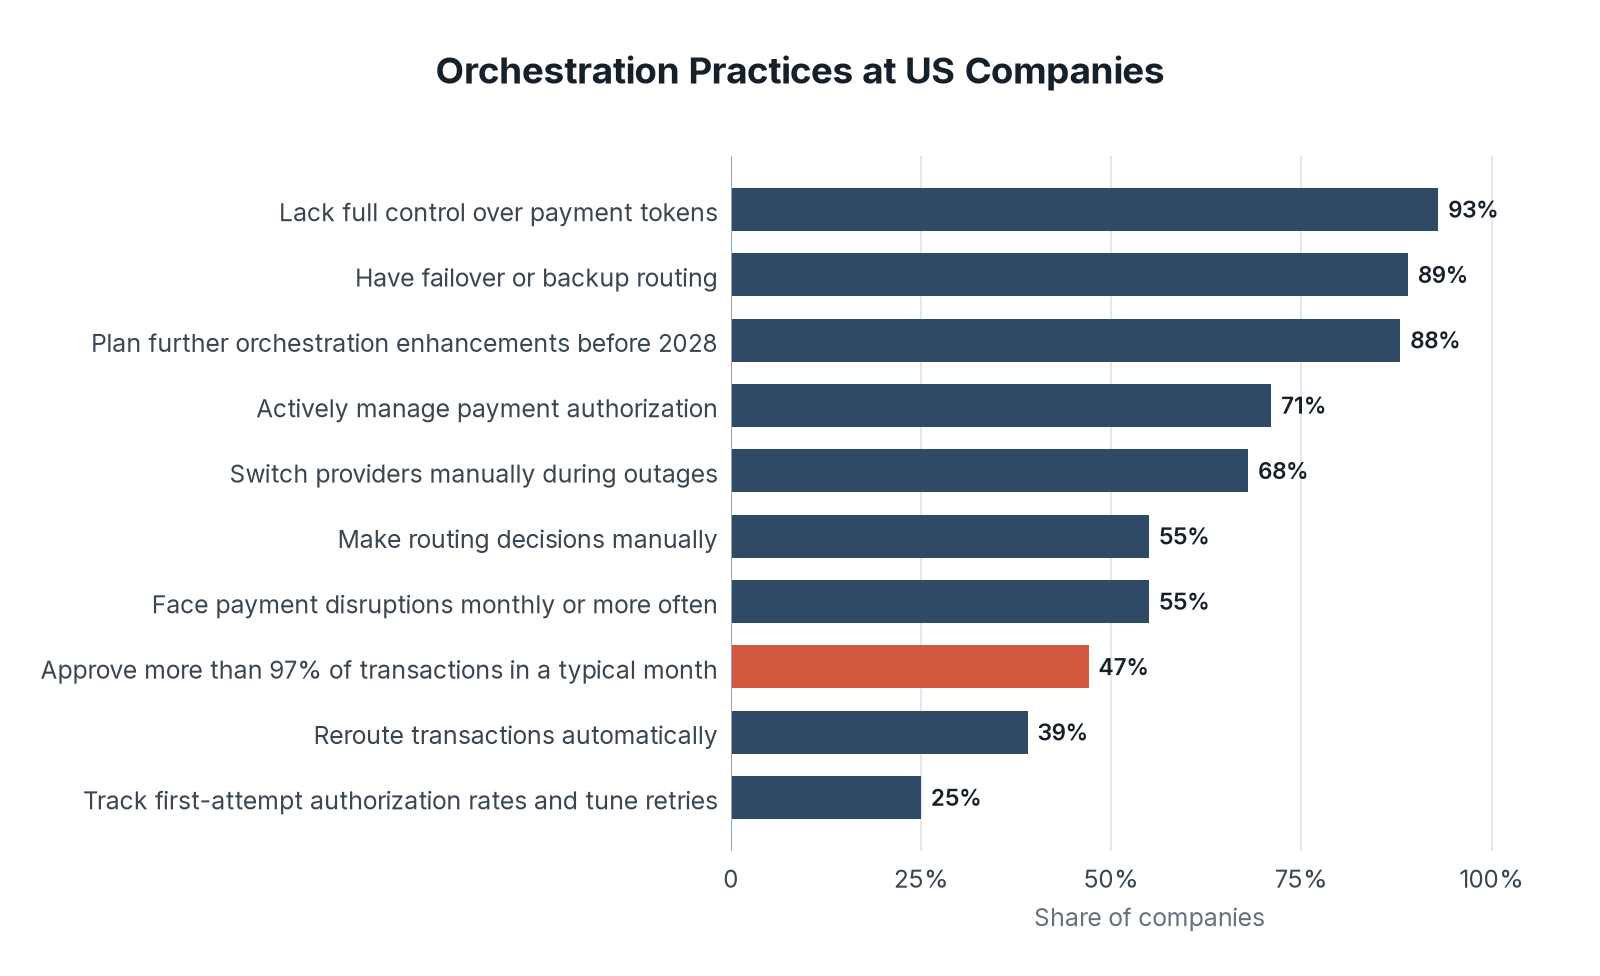
- 89% of companies have failover or backup routing, yet only 47% approve more than 97% of transactions, and only 25% track first-attempt authorization rates and tune their retry logic.
- 93% of companies lack full control over their payment tokens, and no company surveyed can add a new payment provider in less than two weeks.
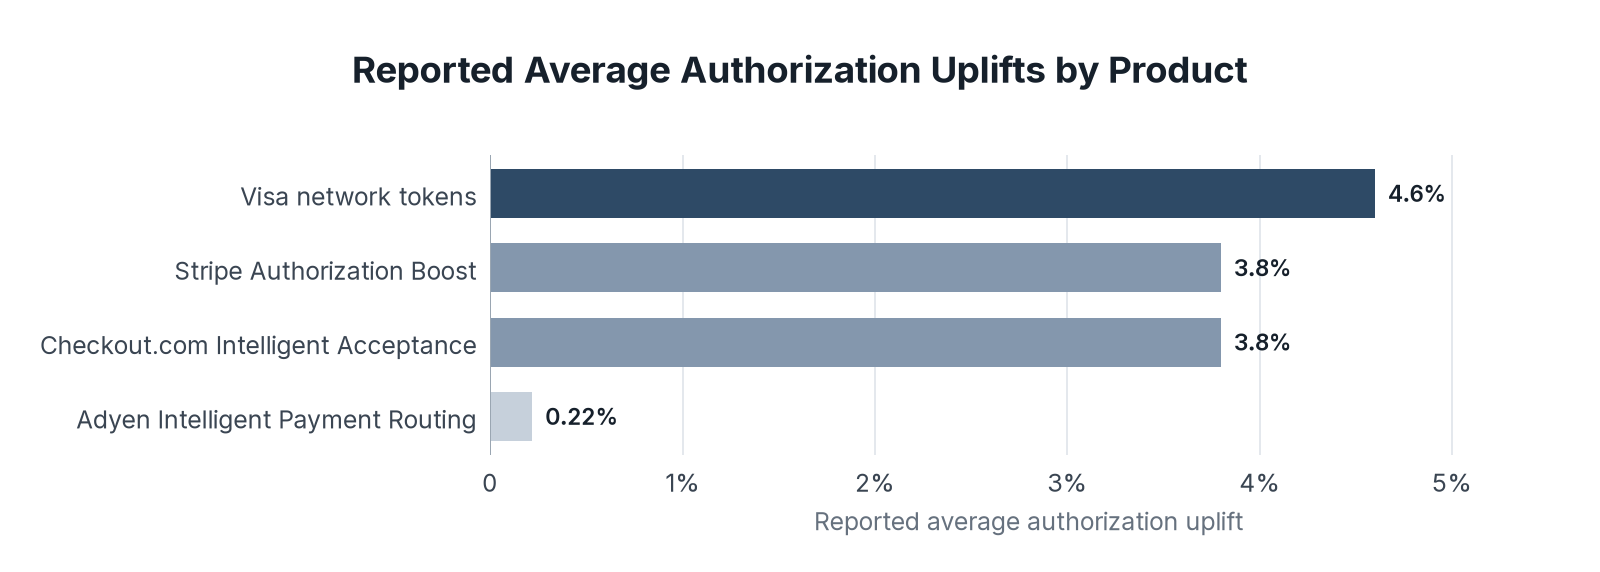
- Providers report average authorization uplifts from 0.22% for Adyen's US debit routing to 4.6% for Visa network tokens on card-not-present payments.
69% of Companies With All Five Capabilities Approve More Than 97% of Transactions, Versus 32% With One or Two
The survey groups companies by how many of five core capabilities they run: automated routing, routing logic updates, failover, token control, and ease of adding new payment rails. Approval rates and completion gains climb sharply only in the top group, while the middle group trails the bottom group on several measures.
| Capability tier | Share of companies | Approve more than 97% of transactions | Report completion gains of 2% or more | Resolve payment issues the same day | Checkout abandonment of 3% or more |
|---|---|---|---|---|---|
| One or two capabilities | 25% | 32% | 7% | 18% | 36% |
| Three or four capabilities | 45% | 42% | 10% | 6% | 42% |
| All five capabilities | 29% | 69% | 78% | 47% | 16% |
Key Findings
- The gap in high approval rates between the top and bottom tiers is 37 percentage points, and companies with all five capabilities are more than twice as likely to approve more than 97% of transactions.
- 78% of the top tier report completion gains of 2% or more, compared with 10% of the middle tier and 7% of the bottom tier.
- The middle tier resolves payment issues the same day only 6% of the time and has the highest checkout abandonment, with 42% of these companies losing 3% or more of checkouts.
89% of Companies Have Failover Routing, but Only 25% Track First-Attempt Authorization Rates
Most companies have the basic plumbing in place. Far fewer automate it or measure it closely, and token control is the weakest link.
| Practice | Share of companies |
|---|---|
| Lack full control over payment tokens | 93% |
| Have failover or backup routing | 89% |
| Plan further orchestration enhancements before 2028 | 88% |
| Actively manage payment authorization | 71% |
| Switch providers manually during outages | 68% |
| Make routing decisions manually | 55% |
| Face payment disruptions monthly or more often | 55% |
| Approve more than 97% of transactions in a typical month | 47% |
| Reroute transactions automatically | 39% |
| Track first-attempt authorization rates and tune retries | 25% |
Key Findings
- More than half of the companies surveyed report authorization failure rates of more than 3%.
- 93% of companies take at least a month to add a new payment provider, and 78% of even the top tier need a month or longer.
- Only 7% of companies have full control over their payment tokens, 66% share control with their providers, and 27% leave tokens entirely with the provider, which makes switching providers slow and costly.
Providers Report Average Authorization Uplifts From 0.22% to 4.6%
Payment networks and processors publish average gains for their own token and routing products. Each figure measures a different thing against a different baseline, so the numbers show the range of reported gains and not a ranking of products.
| Product | Reported average uplift | Scope |
|---|---|---|
| Visa network tokens | 4.6% | Global card-not-present payments on tokens versus card numbers, October to December 2022 |
| Stripe Authorization Boost | 3.8% | Average acceptance increase for merchants using the product |
| Checkout.com Intelligent Acceptance | 3.8% | Average acceptance increase across merchants in 2024 |
| Adyen Intelligent Payment Routing | 0.22% | US debit pilot with more than 20 enterprise merchants in 2024, alongside 26% average cost savings |
Key Findings
- Token products report the largest gains: Visa network tokens lift card-not-present authorization rates by 4.6% and cut online fraud by 30% compared with card numbers.
- Checkout.com ran an average of 60 million real-time optimizations a day in 2024 and raised merchant acceptance rates by an average of 3.8%.
- Adyen's US debit routing pilot is mainly a cost tool: merchants saved 26% on average, some saved as much as 55%, and the largest authorization uplift for a single merchant was 1.15%.
Approval Rates Rise Only When the Whole Orchestration Stack Is in Place
Orchestration pays off when every piece works together. Companies with all five capabilities are more than twice as likely to approve more than 97% of transactions as companies with one or two, while companies with three or four see little gain and more checkout abandonment. Among the 35 payments companies we rate, two sell vaults built for routing between providers: Spreedly, whose vault starts at $750 a month and supports network tokens, and Basis Theory, whose starter plan is $995 a month for 20,000 tokens.
Looking ahead, token control and provider onboarding speed are the gaps most likely to close next. Every company in the top tier plans to improve its orchestration within 12 months, and 88% of all companies plan enhancements before 2028.
So if you route payments across more than one provider, own your tokens and automate routing and retries together, because partial setups add complexity without lifting approval rates.
Data Collection and Methodology
We reviewed sources available in Q4 2026. Capability tiers and practice shares come from a PYMNTS Intelligence survey of 110 US companies across five industry groups and three revenue bands, fielded March 16 to 31, 2026, and published in June 2026 with funding from Spreedly. The five capabilities are automated routing, routing logic updates, failover redundancy, token control, and ease of adding new payment rails. The 37-point gap is 69% minus 32%, and the ratio of top-tier to bottom-tier high approval rates is 69 divided by 32, or 2.2 times.
Provider uplifts are each provider's own published averages for its own customers or network. Visa measures first-attempt authorization rates on global card-not-present payments in October to December 2022. Stripe and Checkout.com report average acceptance increases for merchants using their products. Adyen reports the average result of a 2024 pilot on US debit payments. The baselines differ, so the uplifts are shown side by side for scale only.
Our product and pricing details come from the company reviews published on The Fintech Index as of November 12, 2026, and count reviews that describe the company's own vault or routing product.
Sources
- The Fintech Index analysis of rated companies, November 2026
- PYMNTS Intelligence and Spreedly, The Orchestration Advantage: How Routing Architecture Shapes Payments Performance, June 2026
- Spreedly, The Orchestration Advantage
- Visa, A Deep Dive into Tokenized Transactions
- Stripe, Authorization Boost
- Checkout.com, Checkout.com surpasses $10 billion in revenue unlocked for enterprise merchants using AI-powered boost, March 20, 2025
- Adyen, Adyen's Intelligent Payment Routing Achieves 26% Cost Savings and Improves Payment Performance on US Debit Transactions, September 9, 2024
- Table 1: Source: PYMNTS Intelligence and Spreedly, The Orchestration Advantage, June 2026, survey of 110 US companies fielded March 16 to 31, 2026. Data: approval_by_capability_tier.csv
- Chart 1: Source: PYMNTS Intelligence and Spreedly, The Orchestration Advantage, June 2026, survey of 110 US companies fielded March 16 to 31, 2026.
- Table 2: Source: PYMNTS Intelligence and Spreedly, The Orchestration Advantage, June 2026. Data: orchestration_practices.csv
- Chart 2: Source: PYMNTS Intelligence and Spreedly, The Orchestration Advantage, June 2026.
- Table 3: Source: Visa tokenization overview; Stripe Authorization Boost product page; Checkout.com, March 20, 2025; Adyen, September 9, 2024. Data: provider_reported_uplifts.csv
- Chart 3: Source: Visa tokenization overview; Stripe Authorization Boost product page; Checkout.com, March 20, 2025; Adyen, September 9, 2024.