P2P Lending Return Statistics: 2026 Report

Our analysts reviewed the return, loss, and volume statistics that the peer-to-peer lending platforms we rate publish, covering Mintos, PeerBerry, and Go & Grow from Bondora, as of Q4 2026. We compared headline returns, tracked Mintos gross and net returns by year since 2019, and converted euro volumes to US dollars.
Each platform measures returns its own way. Mintos reports realized net returns after losses, PeerBerry an average annual investment return, and Go & Grow a target rate, so the tables keep those labels.
Key Findings
- Mintos reported a 9.9% net return for 2025, its third straight year with a 0.0% annual net loss.
- Losses wiped out Mintos's gross return in 2022, when a 7.1% gross return became a net return of -1.2%.
- PeerBerry shows a 10.99% average annual investment return and states that it has never had a defaulted loan, while Go & Grow targets up to 6% a year with daily access.
- Mintos investors have put about $14.6B into loans since launch, about 3.6 times PeerBerry's $4.03B.
Headline Returns Range From 6% to 11%
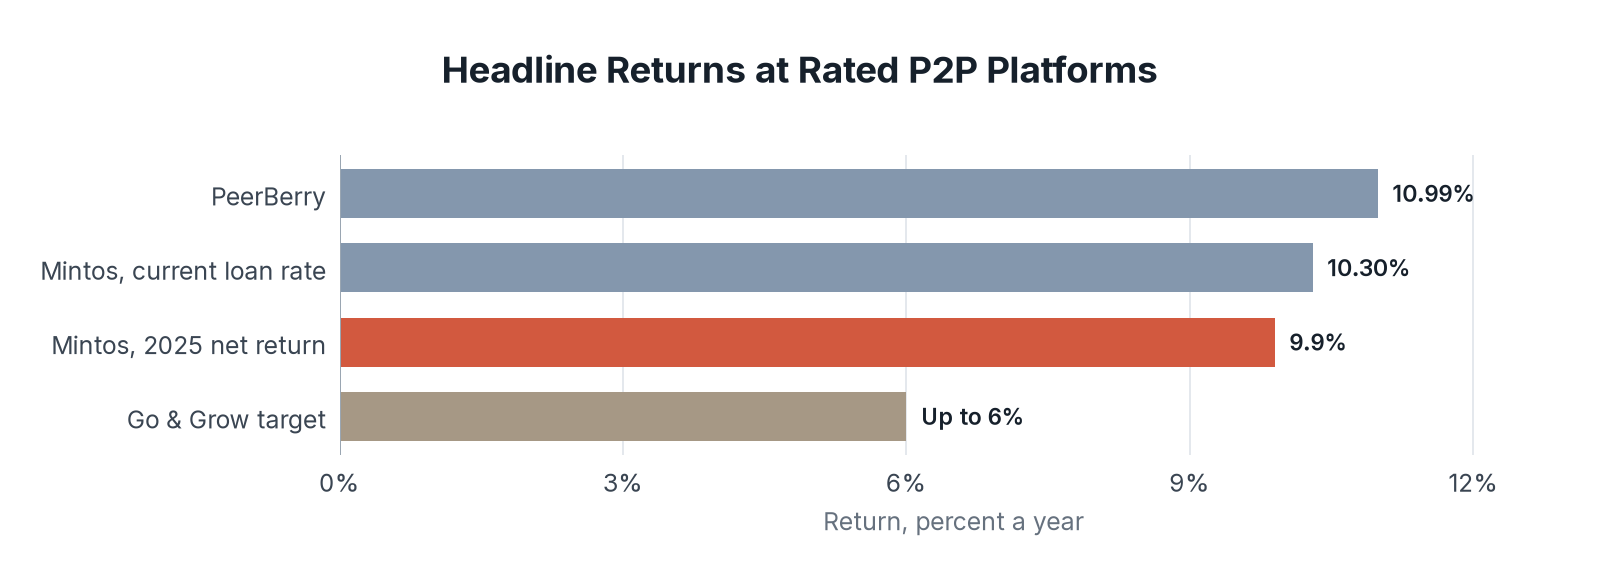
We took each platform's latest headline return from its own statistics or product page. The figures are not on the same basis, which matters more than the gap between them.
| Platform | Headline return | Measure | As of |
|---|---|---|---|
| PeerBerry | 10.99% | Average annual investment return | November 9, 2026 |
| Mintos | 10.30% | Current average interest rate on loans | November 2026 |
| Mintos | 9.9% | Net annual return after losses | Full year 2025 |
| Go & Grow (Bondora) | Up to 6% | Target annual return | November 2026 |
Key Findings
- PeerBerry's 10.99% is the highest headline in this set. It is an average return on investments, not a net figure after losses, though PeerBerry states that it has never had a defaulted loan.
- Mintos's current 10.30% average loan rate is close to its 9.9% realized net return for 2025, a sign that recent losses have been small.
- Go & Grow's target of up to 6% is the lowest rate, in exchange for daily payouts and no lock-up period.
Mintos Net Returns Turned Negative Only in 2022
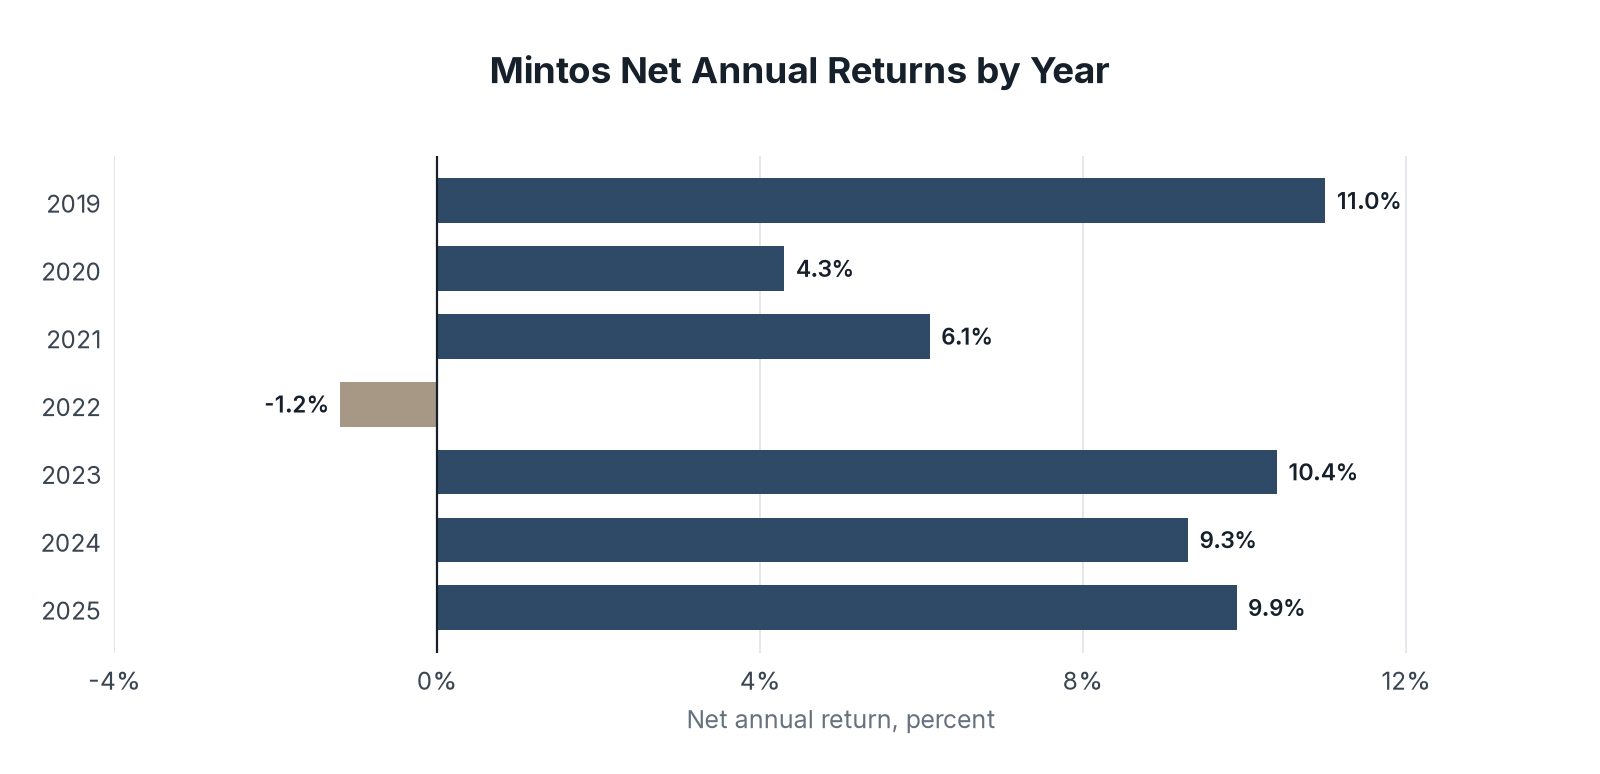
Mintos publishes gross return, net return, and annual net loss for each year since 2015, weighted by outstanding investment across all loans on the platform. The gap between gross and net is the loss after recoveries.
| Year | Gross return | Net return | Annual net loss |
|---|---|---|---|
| 2019 | 11.5% | 11.0% | -0.5% |
| 2020 | 10.6% | 4.3% | -6.3% |
| 2021 | 9.7% | 6.1% | -3.6% |
| 2022 | 7.1% | -1.2% | -8.2% |
| 2023 | 10.4% | 10.4% | 0.0% |
| 2024 | 9.3% | 9.3% | 0.0% |
| 2025 | 9.9% | 9.9% | 0.0% |
Key Findings
- Three of the seven years carried losses of 3.6% or more. Mintos ties the 2020 losses to Covid-19 and the 2022 losses to Russia's war in Ukraine.
- Mintos's five-year net return is 8.9% a year, one point lower than its 9.9% one-year figure.
- Since 2023 gross and net returns have matched, with a reported annual net loss of 0.0% in each year.
Mintos Holds About $14.6B of Cumulative Investment
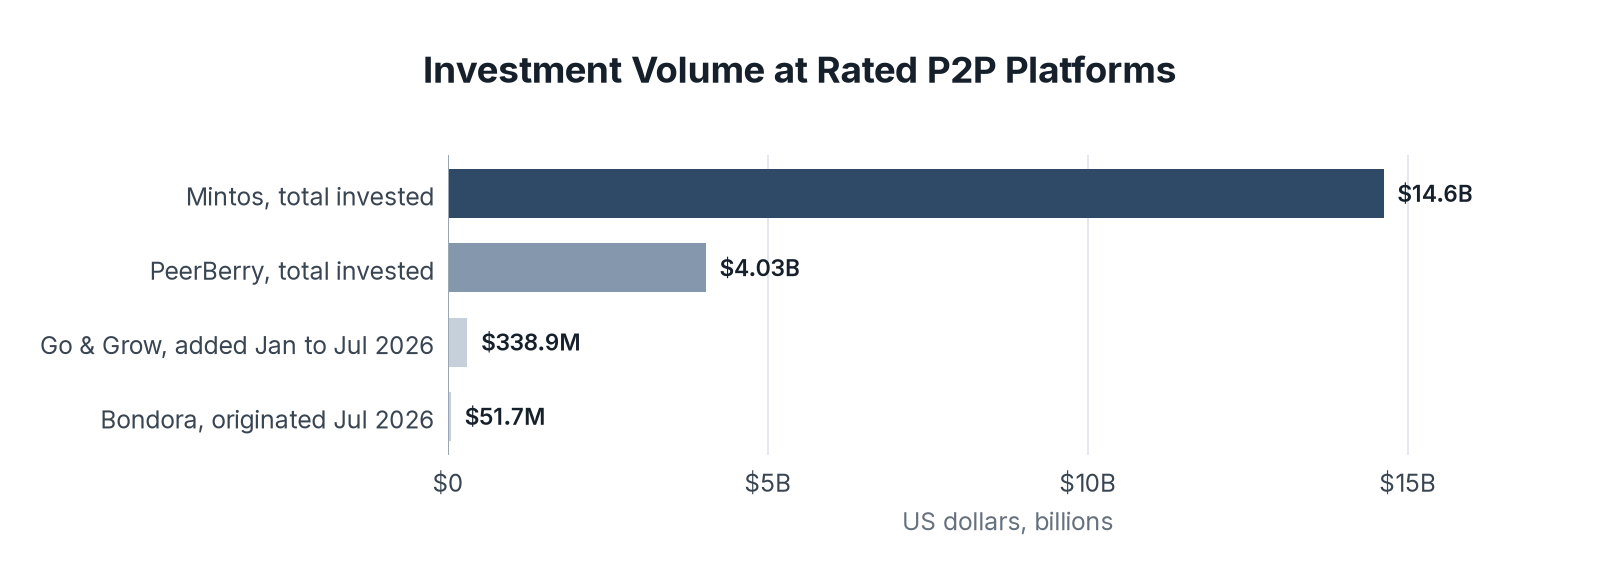
We converted each platform's euro volume figures to US dollars at one Federal Reserve rate. Cumulative totals and recent flows are shown together, so read the measure column first.
| Platform | Measure | Euros | US dollars |
|---|---|---|---|
| Mintos | Total invested since launch | €13.1B | About $14.6B |
| PeerBerry | Total invested since launch | €3.61B | About $4.03B |
| Go & Grow | Added by investors, January to July 2026 | €303.6M | About $338.9M |
| Bondora | Loans originated, July 2026 | €46.3M | About $51.7M |
Key Findings
- Mintos is the largest platform in this set by cumulative investment, at about 3.6 times PeerBerry's total.
- Go & Grow investors added about $338.9M in the first seven months of 2026, about 45% more than in the same period of 2025.
- Go & Grow investors earned €3.86M, about $4.31M, in returns in July 2026, a record month for the product.
Loss Years Decide Realized P2P Returns
Headline P2P returns in this set run from 6% to 11%, and Mintos's record shows how much one bad year can take: 2022 turned a 7.1% gross return into a loss. Its five-year net return of 8.9% is the more useful number for an investor who plans to stay through a full cycle.
Looking ahead, 2026 results will depend on whether lending companies on these platforms keep repaying on schedule, and on how quickly the platforms recover money when a lender fails.
So if you are comparing P2P platforms, put each headline rate next to the platform's worst net year and its five-year net return before you commit money.
Data Collection and Methodology
We reviewed platform statistics available in Q4 2026. Euro figures are converted to US dollars at $1.1163 per euro, the Federal Reserve H.10 rate for October 30, 2026, applied once to each figure. Mintos: €13.1B times 1.1163 equals $14.62B. PeerBerry: €3,609,526,354 times 1.1163 equals $4.029B. Go & Grow additions: €303,555,493 times 1.1163 equals $338.86M. Bondora originations: €46,277,613 times 1.1163 equals $51.66M. Go & Grow July returns: €3,864,674 times 1.1163 equals $4.31M.
Mintos returns assume an investment across all loans on the platform, weighted by total outstanding investment, exclude bonuses and fees, and use Mintos's latest recovery estimates, including write-offs on loans from suspended lending companies. PeerBerry's figure is its own average annual investment return, from a statistics page updated November 9, 2026. Go & Grow's rate is a target, not a guaranteed return.
Go & Grow's year-to-date growth: €303,555,493 divided by €209,848,058 is a 44.7% increase, shown as about 45%. Mintos multiple: $14.62B divided by $4.03B is 3.6. Individual investor results differ with diversification and timing.
Sources
- The Fintech Index analysis of rated companies, Q4 2026
- Mintos historical performance
- Mintos loan statistics
- PeerBerry performance statistics
- Go & Grow and Bondora Group statistics for July 2026
- Go & Grow home page
- Federal Reserve H.10 release of November 2, 2026
- Table 1: Source: The Fintech Index analysis of statistics pages published by PeerBerry, Mintos, and Go & Grow. Data: p2p_headline_returns.csv
- Chart 1: Source: The Fintech Index analysis of statistics pages published by PeerBerry, Mintos, and Go & Grow.
- Table 2: Source: Mintos historical performance statistics. Data: p2p_mintos_returns_by_year.csv
- Chart 2: Source: Mintos historical performance statistics.
- Table 3: Source: Mintos loan statistics, PeerBerry performance statistics, and Go & Grow's July 2026 statistics. Data: p2p_investment_volume.csv
- Chart 3: Source: Mintos loan statistics, PeerBerry performance statistics, and Go & Grow's July 2026 statistics.