Neobank Customer Acquisition Cost Statistics: 2026 Report
What does it cost a digital bank to win a new customer? We divided each company's marketing spending by the customers it added, using its own reports.

Digital banks grow by signing up customers, and what they pay to win each one varies widely.
Our analysts studied eight digital banks and money apps that publish both their marketing spending and their customer counts: Chime, SoFi, Nubank, Dave, Wise, Revolut, Monzo and bunq. We used each company's latest fiscal year, which for most is calendar 2025.
In the following sections, we compare marketing spend per new customer, list the costs the companies report themselves, track changes since 2024, and explain how neobanks count customers.
Neobank Marketing Spend per New Customer by Company
Chime and SoFi spend far more per new customer than the other six companies, which all spend less than $65 per customer added. bunq spends the least.
| Company | Fiscal Year | Marketing Line Used | Marketing Spend | Customer Measure | Customers Added | Basis | Spend per Customer Added | In US Dollars |
|---|---|---|---|---|---|---|---|---|
| Chime | 2025 | Advertising costs | $509.8M | Active Members, 8.0M to 9.5M | 1.5M | Net | $339.87 | $339.87 |
| SoFi | 2025 | Sales and marketing expense | $1,095.4M | Members, 10,127,323 to 13,651,002 | 3,523,679 | Net | $310.87 | $310.87 |
| Monzo | Ended March 2026 | Marketing costs | £143.1M | Customers, 12.2M to 15.2M | 3.0M | Gross and net | £47.69 | $63.92 |
| Wise | Ended March 2026 | Marketing and sales expenses | $171.8M | Active customers, 15.6M to 18.9M | 3.3M | Net | $52.06 | $52.06 |
| Revolut | 2025 | Advertising and marketing | £528.8M | Retail customers, 52.5M to 68.3M | 15.8M | Net | £33.47 | $44.15 |
| Dave | 2025 | Advertising and activation costs | $66.0M | New Members | 3,001,000 | Gross | $21.99 | $21.99 |
| Nubank | 2025 | Marketing expenses | $302.8M | Customers, 114.2M to 131.0M | 16.8M | Net | $18.02 | $18.02 |
| bunq | 2025 | Marketing expenses | €52.1M | Users, 17M to 22M | 5M | Net | €10.42 | $11.78 |
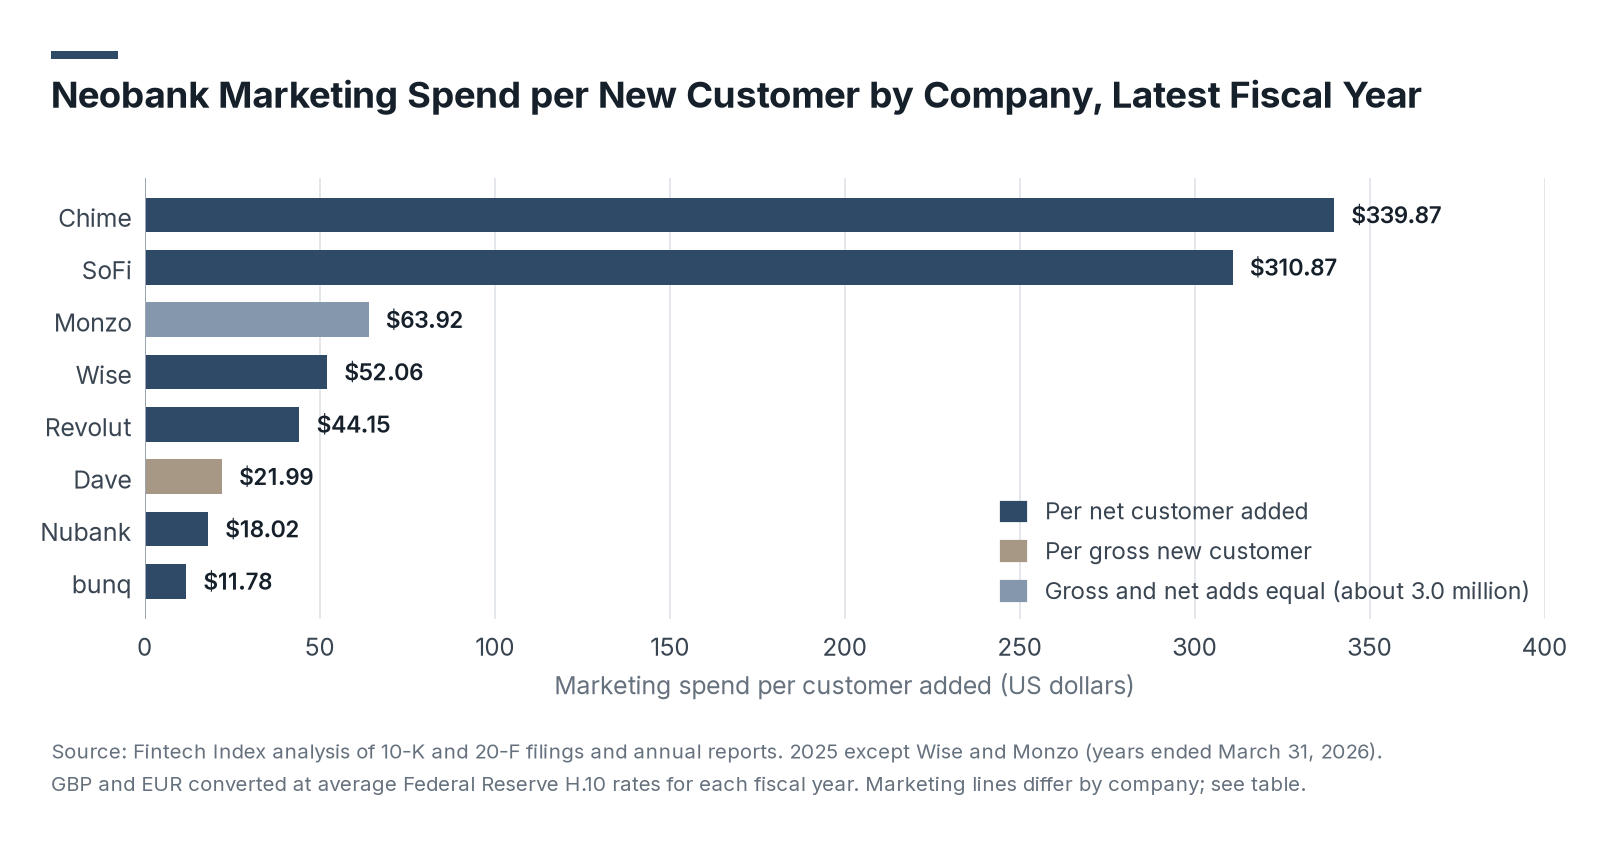
- The median across the eight companies is $48.11 per customer added, halfway between Revolut's $44.15 and Wise's $52.06. The range runs from $11.78 at bunq to $339.87 at Chime.
- Chime and SoFi spent more than $300 for each net customer added, more than four times the next-highest figure, Monzo's $63.92. Both figures are on a net basis, and Chime counts only members who moved money in the last month of the year.
- SoFi's sales and marketing expense of $1,095.4 million is the broadest marketing line among the eight companies. Its 10-K says the line includes staff pay and member incentives. It is a company-wide figure, so it also covers SoFi's Technology Platform business, which sells banking software to other companies. The 10-K attributes the 2025 increase to more advertising and higher lead generation costs.
- Monzo said it welcomed "more than 3m" new customers in its 2026 fiscal year and that its total rose to 15.2 million from 12.2 million, so its gross and net figures are both about 3 million. Monzo's figures include business customers: 280,000 of the new customers were businesses. Monzo's annual report says 79% of new customers joined through word of mouth, and its referral costs were £29.5 million.
- The cost of winning a customer varies by more than 25 times across the group. The median is $48.11 per customer added, from $11.78 at bunq to $339.87 at Chime.
Company-Reported Neobank Customer Acquisition Costs
Dave and Nubank are the only companies here that report a customer acquisition cost of their own, and both come in below their total marketing spend per new customer. Part of the gap is what each company counts as an acquisition cost. For Nubank there is a second reason: its own figure is spread over every new customer, while the $18.02 is spread over net additions, which are smaller because they subtract customers who left.
| Company | Company Definition | Company-Reported Acquisition Cost, 2025 | Company-Reported Acquisition Cost, 2024 | Marketing Spend per Customer Added, 2025 |
|---|---|---|---|---|
| Dave | Customer acquisition cost per new Member | About $19 | n/a | $21.99 per gross new Member |
| Nubank | Card printing and shipping, credit data costs and paid marketing, per customer | $7.4 | $6.4 | $18.02 per net customer added |
| Quarter | New Members | Customer Acquisition Cost |
|---|---|---|
| Q4 2024 | 766,000 | $16 |
| Q1 2025 | 569,000 | $18 |
| Q2 2025 | 722,000 | $19 |
| Q3 2025 | 843,000 | $19 |
| Q4 2025 | 867,000 | $20 |
| Q1 2026 | 695,000 | $18 |
| Q2 2026 | 951,000 | $19 |
- Nubank's own customer acquisition cost was $7.4 in 2025, up from $6.4, with paid marketing making up about 32% of it. Its total marketing expense divided by net customers added was $18.02. The company figure counts card, credit data and paid marketing costs per new customer, while the $18.02 divides all marketing expense by the net change in customers.
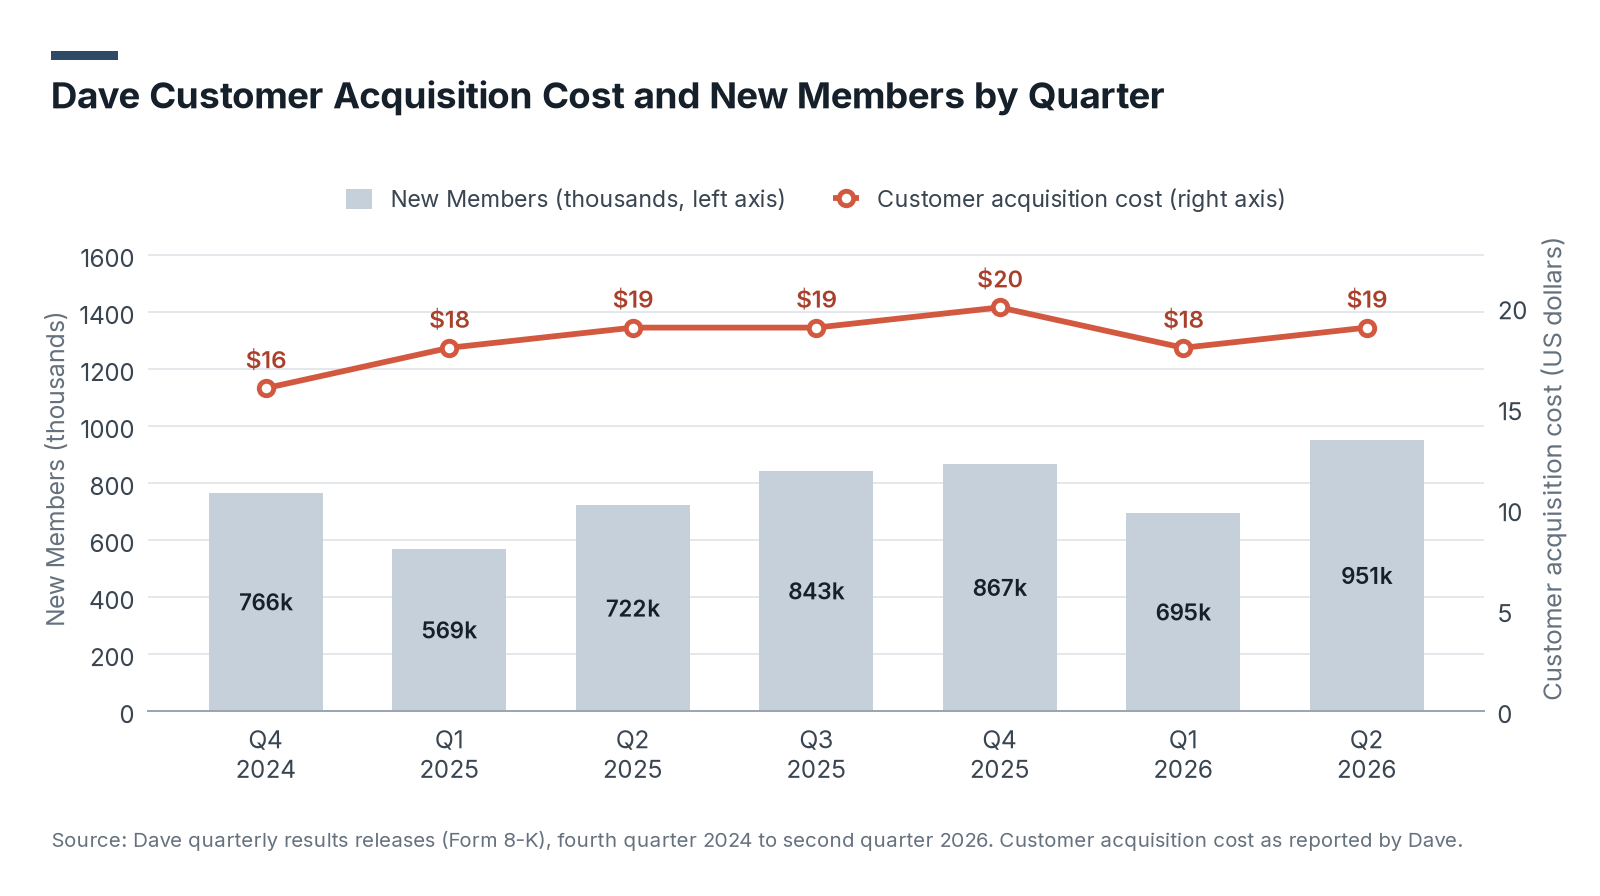
- Dave's quarterly cost ranged from $16 to $20 over the seven quarters, while new Members ranged from 569,000 to 951,000. Dave's second-quarter 2026 release says its marketing and activation spending grew 32% from a year earlier while its cost per new Member held at $19.
- Company-reported acquisition costs are far lower than total marketing spend per customer. Nubank reports $7.4, while its total marketing per net customer was $18.02.
Change in Neobank Marketing Spend per Net Customer Added, 2024 to 2025
Marketing spend per net customer added rose in 2025 at all four companies that give customer counts for the end of 2023, 2024 and 2025. It rose most sharply at Nubank and barely moved at SoFi.
| Company | 2024 | 2025 | Change |
|---|---|---|---|
| Nubank | $12.14 | $18.02 | +48.5% |
| Revolut | £24.78 | £33.47 | +35.1% |
| Chime | $326.14 | $339.87 | +4.2% |
| SoFi | $307.99 | $310.87 | +0.9% |
- Nubank's jump had two causes of about the same size. Its marketing expense rose to $302.8 million from $246.4 million, and it added 16.8 million net customers in 2025, down from 20.3 million in 2024. The extra spending did slightly more to raise the cost than the slower customer growth did.
- Revolut's spending grew much faster than its sign-ups: advertising and marketing rose to £528.8 million while net retail customer additions rose only to 15.8 million from 14.5 million.
- Acquiring customers is getting more expensive at most neobanks. Nubank's marketing rose to $302.8 million while net adds slowed to 16.8 million, and Revolut's spending outpaced sign-ups.
Neobank Marketing Spend Growth and Customer Growth
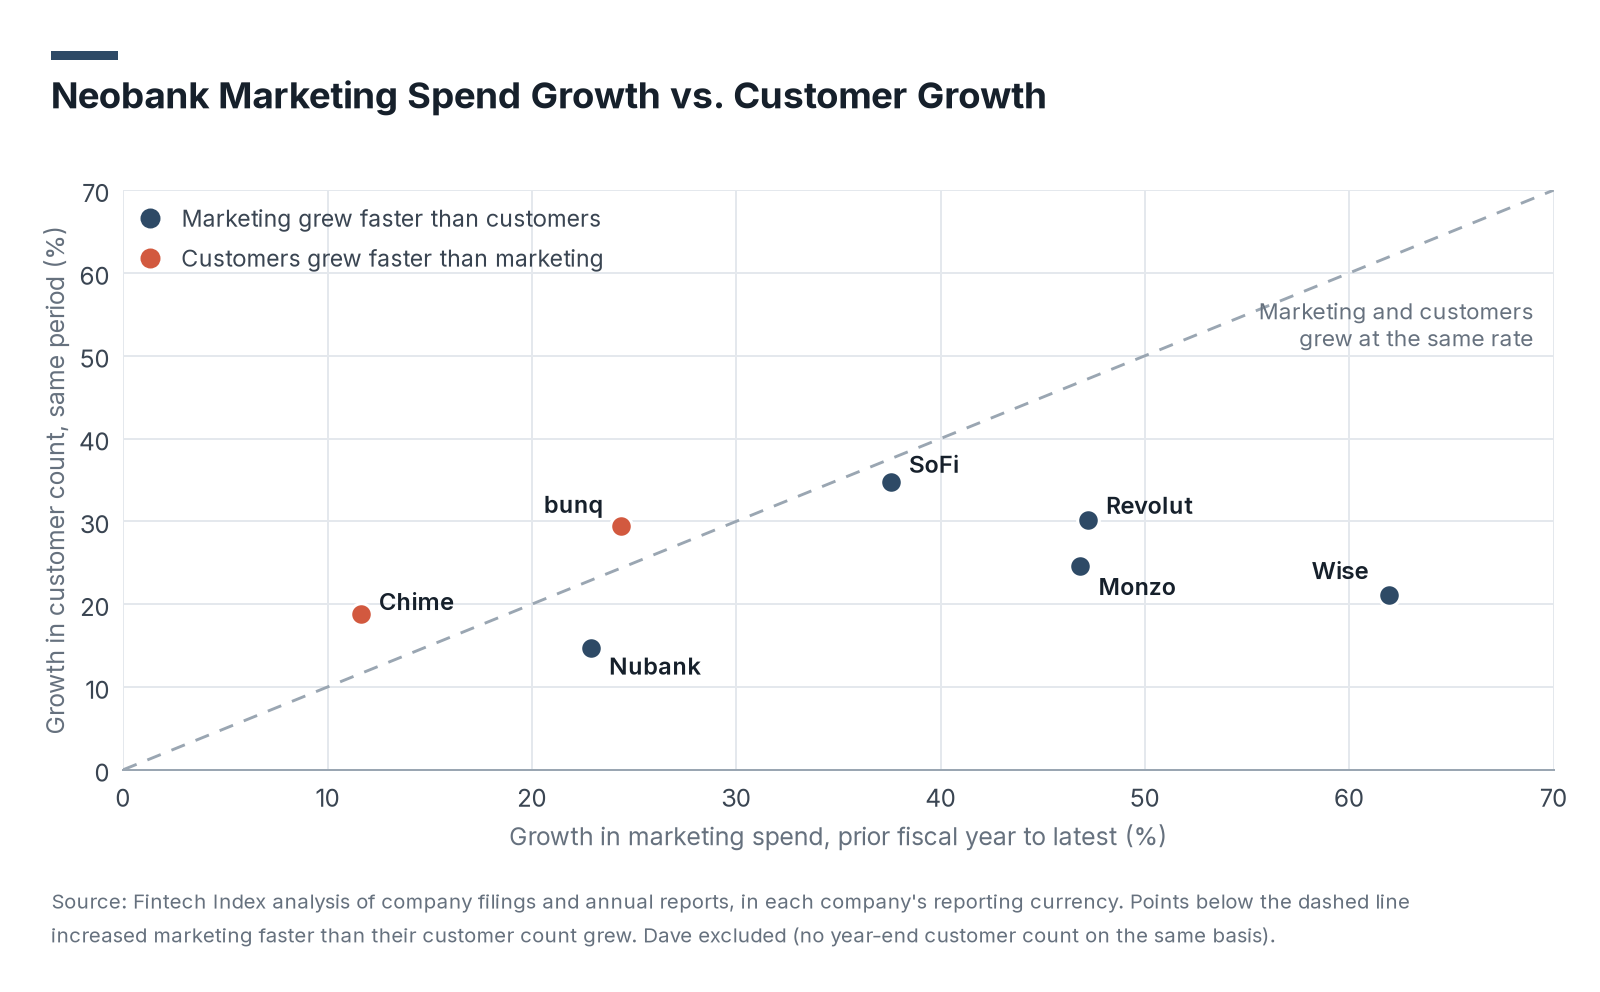
A bank that raises its marketing budget faster than it adds customers is paying more for each customer it wins. In the latest fiscal year, five of the seven companies with comparable customer counts were in that position, with growth measured in each company's own currency.
| Company | Marketing Spend Growth | Customer Count Growth |
|---|---|---|
| Wise | 61.9% | 21.2% |
| Revolut | 47.2% | 30.1% |
| Monzo | 46.8% | 24.6% |
| SoFi | 37.6% | 34.8% |
| bunq | 24.4% | 29.4% |
| Nubank | 22.9% | 14.7% |
| Chime | 11.7% | 18.8% |
- Wise had the widest gap. Its 20-F says the increase in marketing and sales expenses was "primarily due to higher advertising spend across our existing paid marketing channels along with headcount increases, with average headcount growth of 42%," and that the advertising growth included "the launch of awareness marketing to build brand awareness in key markets, to fuel long-term growth."
- Higher spending is not always buying faster growth. Wise grew marketing much faster than its customer count, while Chime and bunq grew customers faster than spending.
What Neobank Customer Acquisition Cost Trends Mean for 2027 and Beyond
Every sign-up bonus, referral reward and ad that brings a new customer to a digital bank is a cost the bank has to earn back from that customer over time. Banks that grow mainly through word of mouth spend a fraction of what heavy advertisers spend, which leaves them more room for free accounts and low fees.
Winning customers got more expensive in 2025 at every company we could compare, and most raised marketing faster than they added customers. If that continues, banks could scale back bonuses or lean harder on referrals, which would change the offers new customers see.
So if you're opening a digital bank account, ask a friend who already uses it for a referral link first.
Data Collection and Methodology
The companies define a customer and a marketing cost in different ways, so the gaps between them are partly a matter of counting.
- Chime counts Active Members who made a money movement transaction in the last month of the year. Wise counts active customers who made at least one cross-border transaction in the year. SoFi counts anyone with a loan, an account, a linked external account or its credit score monitoring service.
- bunq reports its user counts in round millions, so its net additions of 5 million could be off by up to 1 million in either direction. Chime's Active Member counts are rounded to a tenth of a million.
- Revolut's 2025 annual report lists user onboarding costs of £24.5 million and sales-related staff costs of £130.0 million separately from advertising and marketing. Neither is included in its figure here.
Customer acquisition cost here is a company's yearly marketing spend divided by the customers it added that year. A bank that spends $50 million on marketing and adds 1 million customers spends $50 per new customer.
Five of the companies are publicly traded, and Revolut, Monzo and bunq are privately held. Most report on the calendar year 2025. Wise's and Monzo's fiscal years ended March 31, 2026.
Only Dave and Monzo say how many new customers they signed up during the year, a gross figure that counts every new customer. For the others, customers added is the change in the year-end customer count, a net figure that shrinks when accounts close or go inactive, so net figures run higher per customer than gross ones would. Revolut's and Monzo's pounds and bunq's euros are shown in dollars at the Federal Reserve's average exchange rate for each company's fiscal year.
Starling is not included because its 2026 annual report gives a marketing expense figure, £17.6 million, but no year-end count of its own customers: its 6.2 million group platform accounts also count accounts run through its Engine software for partner banks. MoneyLion is not included because it stopped filing its own reports after Gen Digital completed its purchase of the company on April 17, 2025.
Sources
- Fintech Index, Neobank Customer Acquisition Cost Study: analysis of 2025 and 2026 annual filings and reports from eight digital banks and money apps, conducted October 2026.
- Chime annual report for 2025. Chime Financial, Form 10-K, March 6, 2026.
- SoFi annual report for 2025. SoFi Technologies, Form 10-K, February 17, 2026.
- Nu Holdings annual report for 2025. Nu Holdings, Form 20-F, April 8, 2026.
- Dave annual report for 2025. Dave Inc., Form 10-K, March 2, 2026.
- Dave fourth quarter and full year 2024 results. Dave Inc., Form 8-K, March 3, 2025.
- Dave first quarter 2025 results. Dave Inc., Form 8-K, May 8, 2025.
- Dave second quarter 2025 results. Dave Inc., Form 8-K, August 6, 2025.
- Dave third quarter 2025 results. Dave Inc., Form 8-K, November 4, 2025.
- Dave fourth quarter and full year 2025 results. Dave Inc., Form 8-K, March 2, 2026.
- Dave first quarter 2026 results. Dave Inc., Form 8-K, May 5, 2026.
- Dave second quarter 2026 results. Dave Inc., Form 8-K, August 5, 2026.
- Wise annual report for the year ended March 31, 2026. Wise Group, Form 20-F, June 25, 2026.
- Revolut Annual Report 2025. Revolut Group Holdings, 2026.
- Monzo Annual Report 2026. Monzo Bank, 2026.
- bunq Annual Report 2025. bunq, 2026.
- bunq Annual Report 2024. bunq, 2025. Used for the 2024 user count.
- US dollars to UK pound sterling spot exchange rate (DEXUSUK). Board of Governors of the Federal Reserve System, H.10 release, via FRED. Daily rates averaged by Fintech Index.
- US dollars to euro spot exchange rate (DEXUSEU). Board of Governors of the Federal Reserve System, H.10 release, via FRED. Daily rates averaged by Fintech Index.
- Starling Group Annual Report 2026. Starling Bank, 2026. Used for the reason Starling is excluded.
- MoneyLion current report on completion of its merger with Gen Digital. MoneyLion Inc., Form 8-K, April 17, 2025. Used for the reason MoneyLion is excluded.