Fintech Venture Debt Statistics: 2026 Report

Our analysts reviewed PitchBook-NVCA Venture Monitor figures on US venture debt from 2023 through Q3 2026, 12 annual and year-to-date capital and deal-count records, plus average deal-size calculations from those totals, to show how venture lending has concentrated into fewer, larger facilities as of Q4 2026.
Key Findings
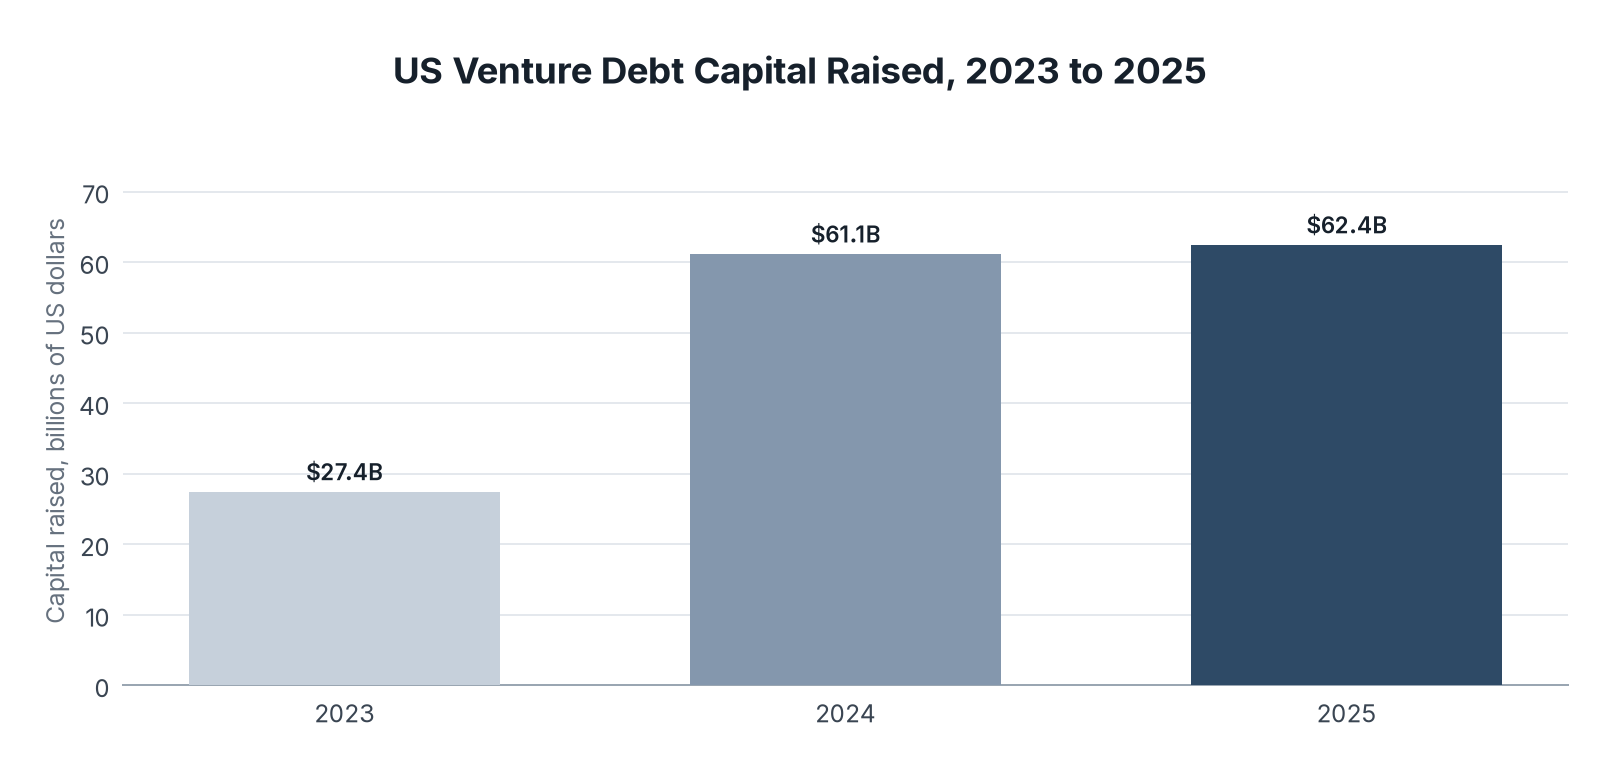
- US venture debt capital raised reached a record $62.4 billion in 2025 across 943 deals, up from $61.1 billion in 2024 and more than double the $27.4 billion raised in 2023.
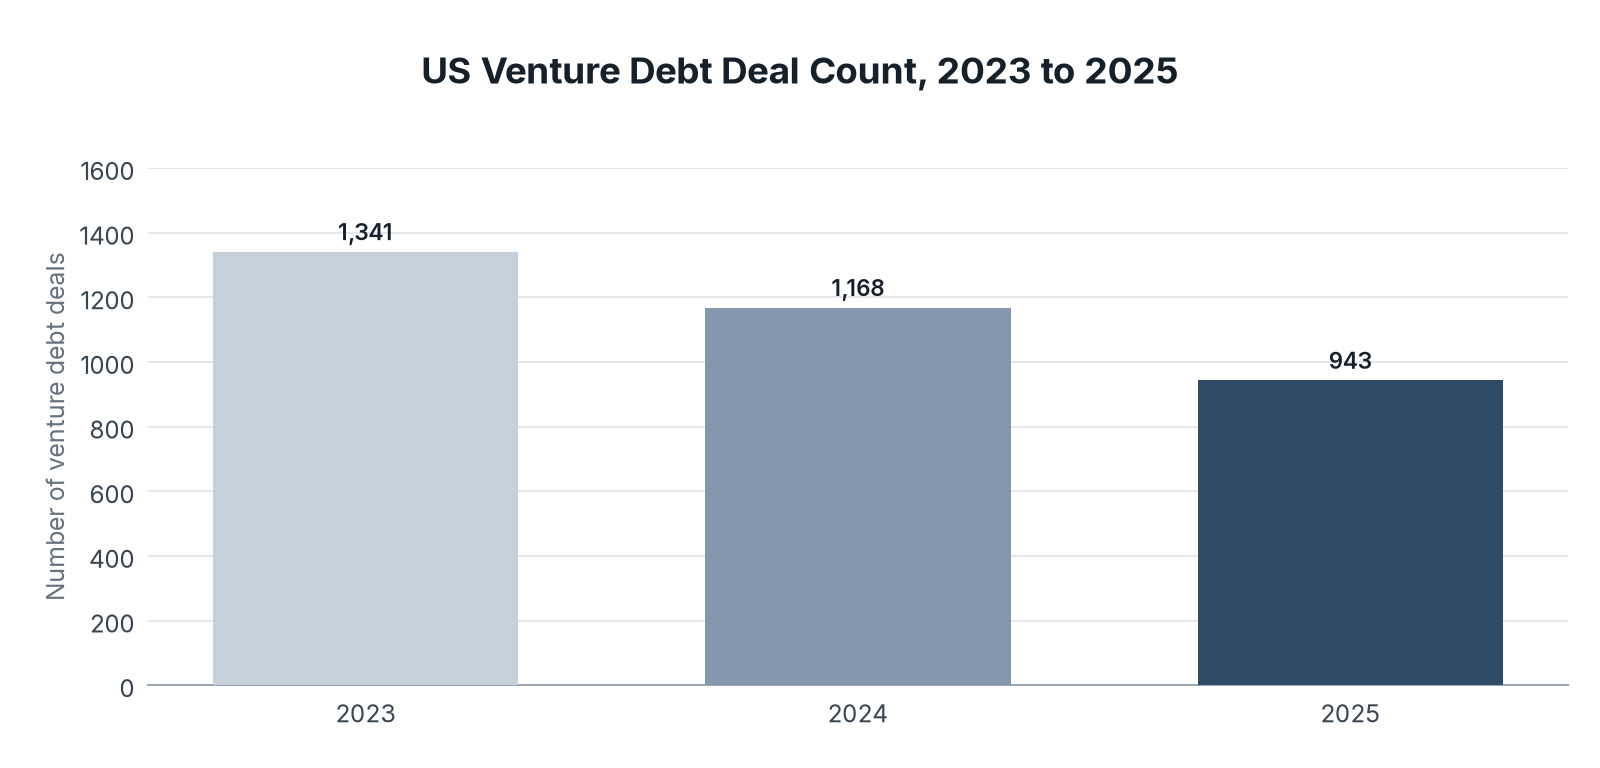
- Deal count fell from 1,341 in 2023 to 943 in 2025, a 29.7% drop, even as capital rose.
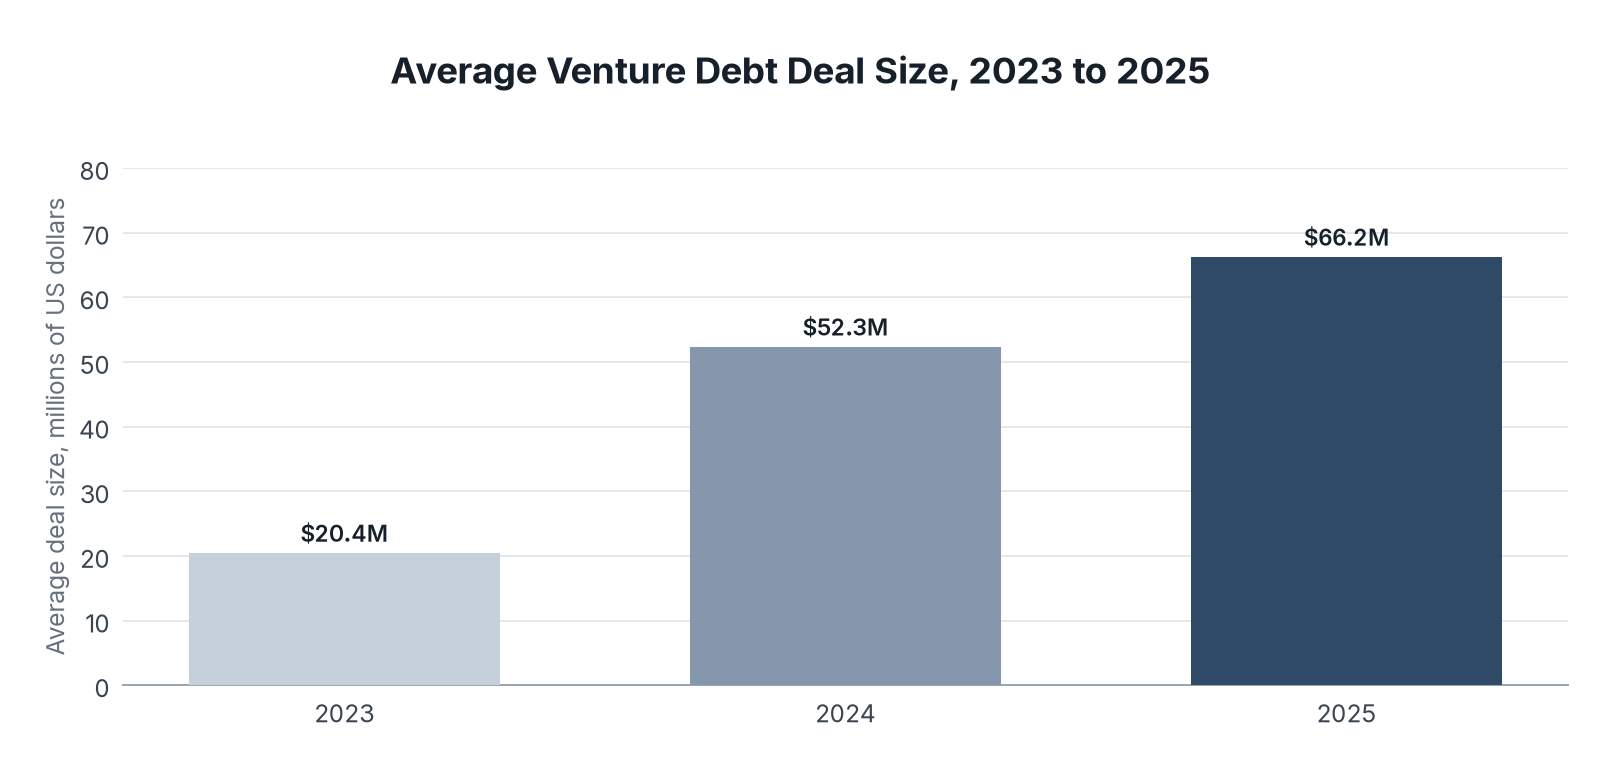
- Average deal size rose from $20.4 million in 2023 to $66.2 million in 2025, more than triple.
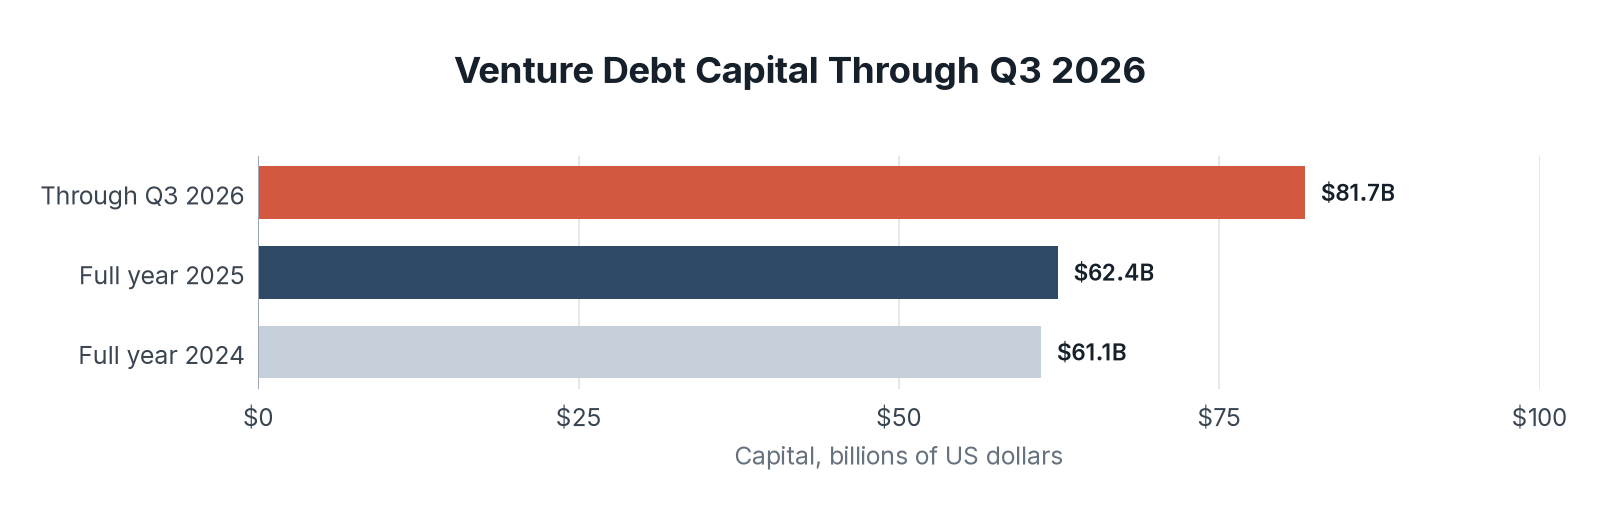
- Through Q3 2026, PitchBook-NVCA reported $81.7 billion in debt taken on by VC-backed companies, already ahead of the full-year 2025 total.
- The market has shifted toward fewer, much larger loans concentrated among established and AI-related borrowers.
Venture debt is a loan to a venture-backed company, usually alongside equity rounds, that extends runway without the same dilution as a new equity raise. Fintech operators, lenders, and investors watch the market because facility size, availability, and lender appetite shape how startups fund growth between equity rounds.
We gathered annual deal counts and capital raised from the PitchBook-NVCA Venture Monitor for 2023, 2024, and 2025, calculated average deal size from those totals, and set them against the Q3 2026 Monitor figure for debt taken on by VC-backed companies. All figures are in US dollars, so no currency conversion was needed.
In the following sections, we compare capital raised, deal counts, average deal size, and the through-Q3 2026 total.
Capital Raised Hit A New High In 2025
Capital raised shows how much venture debt closed each year. We gathered PitchBook-NVCA annual totals for 2023 through 2025.
| Year | Capital raised, billions of US dollars | Deal count | Average deal size, millions of US dollars |
|---|---|---|---|
| 2023 | $27.4 | 1,341 | $20.4 |
| 2024 | $61.1 | 1,168 | $52.3 |
| 2025 | $62.4 | 943 | $66.2 |
Key Findings
- Capital raised more than doubled from 2023 to 2024, from $27.4 billion to $61.1 billion, then edged up to $62.4 billion in 2025.
- 2025 set a new annual record for capital even as deal count kept falling.
- The jump from 2023 to 2024 marks the shift toward larger facilities instead of a simple rebound in deal volume.
Deal Count Kept Falling As Facilities Got Larger
Deal count shows how many venture debt transactions closed. We gathered annual counts for the same three years.
| Year | Deal count | Change from prior year, percent |
|---|---|---|
| 2023 | 1,341 | n/a |
| 2024 | 1,168 | -12.9 |
| 2025 | 943 | -19.3 |
Key Findings
- Deal count fell 29.7% from 2023 to 2025, from 1,341 to 943.
- The 2025 decline of 19.3% was steeper than the 12.9% drop in 2024.
- Fewer deals alongside rising capital means the typical facility is much larger than it was two years earlier.
Average Deal Size More Than Tripled Since 2023
Average deal size shows how large a typical facility has become. We divided annual capital by annual deal count.
| Year | Average deal size, millions of US dollars |
|---|---|
| 2023 | $20.4 |
| 2024 | $52.3 |
| 2025 | $66.2 |
Key Findings
- Average deal size rose from $20.4 million in 2023 to $66.2 million in 2025, a 224% increase.
- Most of the jump landed in 2024, when the average rose from $20.4 million to $52.3 million.
- PitchBook has described the market as fewer, much larger loans concentrated among established and AI-related borrowers.
Through Q3 2026 Already Tops Full-Year 2025
Year-to-date capital shows whether 2026 is still expanding. We set the Q3 2026 PitchBook-NVCA figure for debt taken on by VC-backed companies against the full-year 2024 and 2025 totals.
| Period | Capital, billions of US dollars |
|---|---|
| Through Q3 2026 | $81.7 |
| Full year 2025 | $62.4 |
| Full year 2024 | $61.1 |
Key Findings
- Through Q3 2026 alone, reported debt for VC-backed companies reached $81.7 billion, already ahead of the full-year 2025 record of $62.4 billion.
- Full-year 2025 capital of $62.4 billion was only 2.1% higher than 2024's $61.1 billion, so the 2026 pace marks a new step up.
- Lenders and borrowers should treat the Q3 2026 figure as a different reporting cut than the annual deal tables, because the Monitor describes it as debt taken on by VC-backed companies instead of a simple year-to-date deal sum.
What Venture Debt Data Means For Fintech Operators In 2026
Venture debt has become a large-facility market. Capital is at record levels, deal counts are down, and average size has more than tripled since 2023. Through Q3 2026, reported debt for VC-backed companies already exceeds the full-year 2025 total.
Fintech companies that can clear lender credit boxes will find larger checks available than two years ago, while earlier-stage borrowers may face a thinner menu of small facilities. Equity investors will keep using venture debt to stretch runway between rounds, and debt providers will keep concentrating on later-stage and AI-heavy books.
So if you are planning a fintech raise in 2026, size the debt ask to today's larger average facility and confirm early whether your stage still fits the lenders writing those checks.
Data Collection and Methodology
All annual deal counts and capital figures come from the PitchBook-NVCA Venture Monitor for 2023, 2024, and 2025. Average deal size is our calculation, annual capital divided by annual deal count, rounded to one decimal place in millions of US dollars. The through Q3 2026 figure of $81.7 billion is the debt taken on by VC-backed companies as reported in the Q3 2026 PitchBook-NVCA Venture Monitor; that cut is not identical to the annual deal-capital series, and we present it in its own table for that reason.
We did not allocate a fintech-only share of venture debt from the Monitor, because PitchBook-NVCA does not publish a stable fintech cut of the debt series in the same tables. All figures are in US dollars, so no currency conversion was needed. Percent changes are our calculations from the published annual totals.
Sources
- The Fintech Index analysis of PitchBook-NVCA venture debt totals, conducted November 2026
- PitchBook-NVCA Venture Monitor, Q4 2025 and Q3 2026 editions
- PitchBook News, coverage of 2025 US venture debt totals and deal concentration
- Table, US Venture Debt Capital Raised: Source: PitchBook-NVCA Venture Monitor (Source 2). Average deal size is The Fintech Index calculation (Source 1). Data: venture_debt_by_year.csv
- Chart, US Venture Debt Capital Raised: Source: PitchBook-NVCA Venture Monitor.
- Table, US Venture Debt Deal Count: Source: PitchBook-NVCA Venture Monitor (Source 2). Data: venture_debt_by_year.csv
- Chart, US Venture Debt Deal Count: Source: PitchBook-NVCA Venture Monitor.
- Table, Average Venture Debt Deal Size: Source: The Fintech Index calculation (Source 1) from PitchBook-NVCA Venture Monitor (Source 2). Data: venture_debt_average_size.csv
- Chart, Average Venture Debt Deal Size: Source: The Fintech Index calculation from PitchBook-NVCA Venture Monitor deal counts and capital raised.
- Table, Venture Debt Capital Through Q3 2026: Source: PitchBook-NVCA Venture Monitor (Source 2). The through Q3 2026 figure is debt taken on by VC-backed companies as reported in the Q3 2026 Monitor. Data: venture_debt_ytd_2026.csv
- Chart, Venture Debt Capital Through Q3 2026: Source: PitchBook-NVCA Venture Monitor. The through Q3 2026 figure is debt taken on by VC-backed companies as reported in the Q3 2026 Monitor.