Fintech Startup Burn Rate Statistics: 2026 Report
Monthly net burn across 412 venture-backed fintech startups, by funding stage, segment, spending mix, and runway at the next raise.
This report looks at monthly net burn across 412 venture-backed fintech startups, from pre-seed through Series C and later. Net burn here means total cash spent in a month minus cash collected. Below, we break burn down by funding stage, fintech segment, and spending category, and show how runway and burn efficiency relate to a company's odds of raising its next round on good terms.
Median Monthly Net Burn by Funding Stage
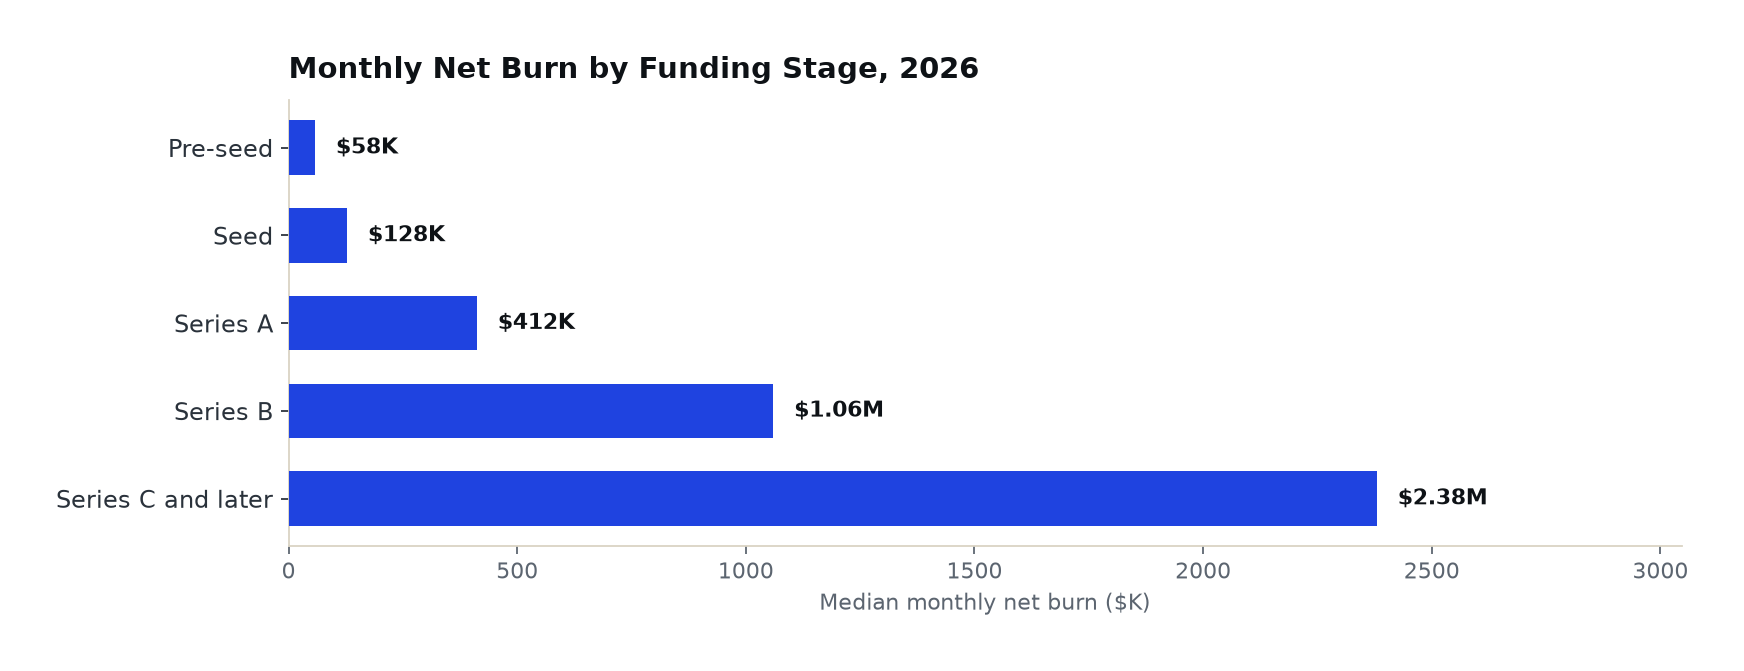
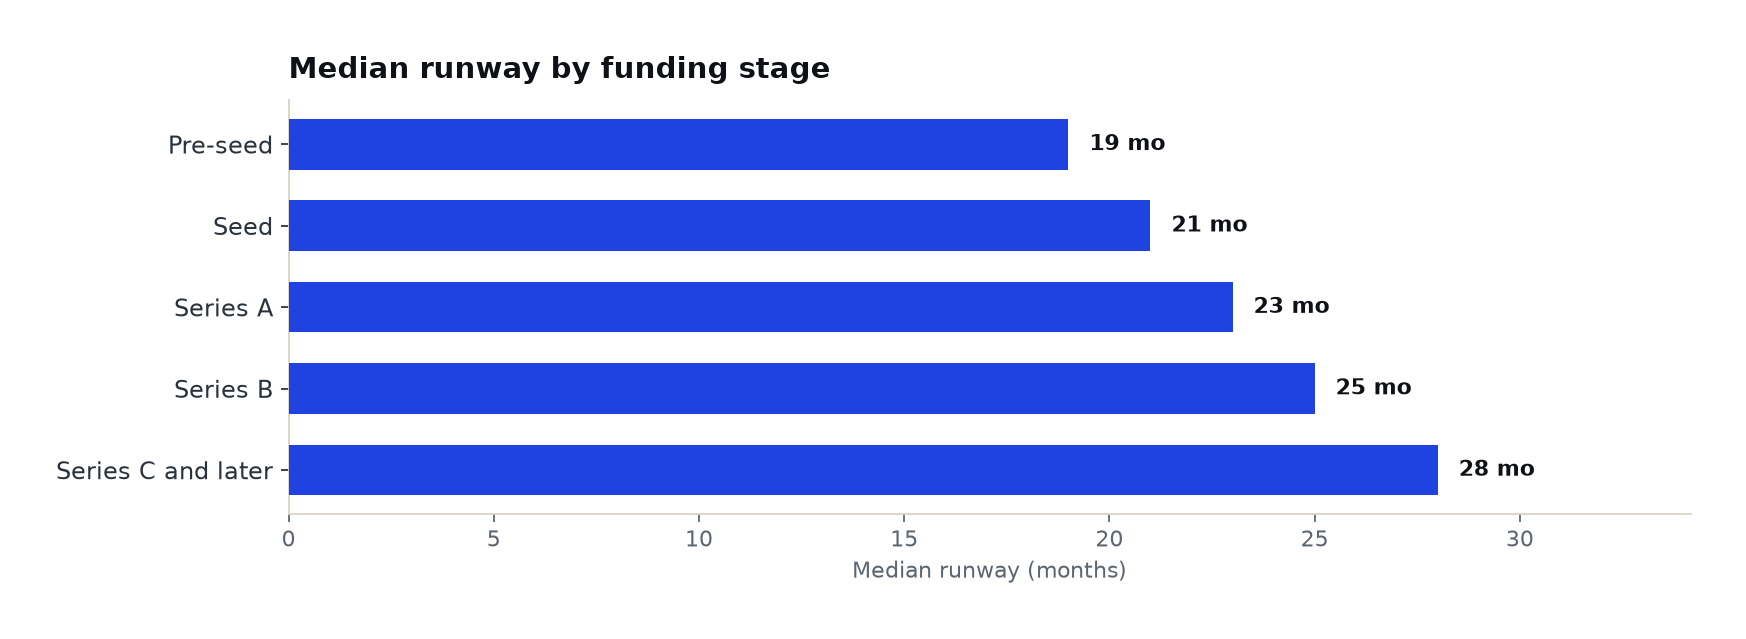
The table below shows median monthly net burn at each funding stage, the 25th and 75th percentile values, and the median months of runway companies held at the time of our analysis.
| Funding Stage | Companies Analyzed | Median Monthly Net Burn | 25th Percentile | 75th Percentile | Median Runway (Months) |
|---|---|---|---|---|---|
| Pre-seed | 61 | $58K | $32K | $95K | 19 |
| Seed | 118 | $128K | $74K | $205K | 21 |
| Series A | 124 | $412K | $245K | $640K | 23 |
| Series B | 72 | $1.06M | $680K | $1.62M | 25 |
| Series C and later | 37 | $2.38M | $1.45M | $3.90M | 28 |
- Median net burn rises 3.2x from seed ($128K per month) to Series A ($412K), the largest stage-to-stage jump in our dataset. The step from Series A to Series B is 2.6x.
- The gap between the 25th and 75th percentile widens in dollar terms as companies mature, from $131K per month at seed to $940K at Series B.
- Runway lengthens with each stage, from 19 months at pre-seed to 28 months at Series C and later, because later rounds are larger relative to monthly spending.
Monthly Net Burn by Fintech Segment
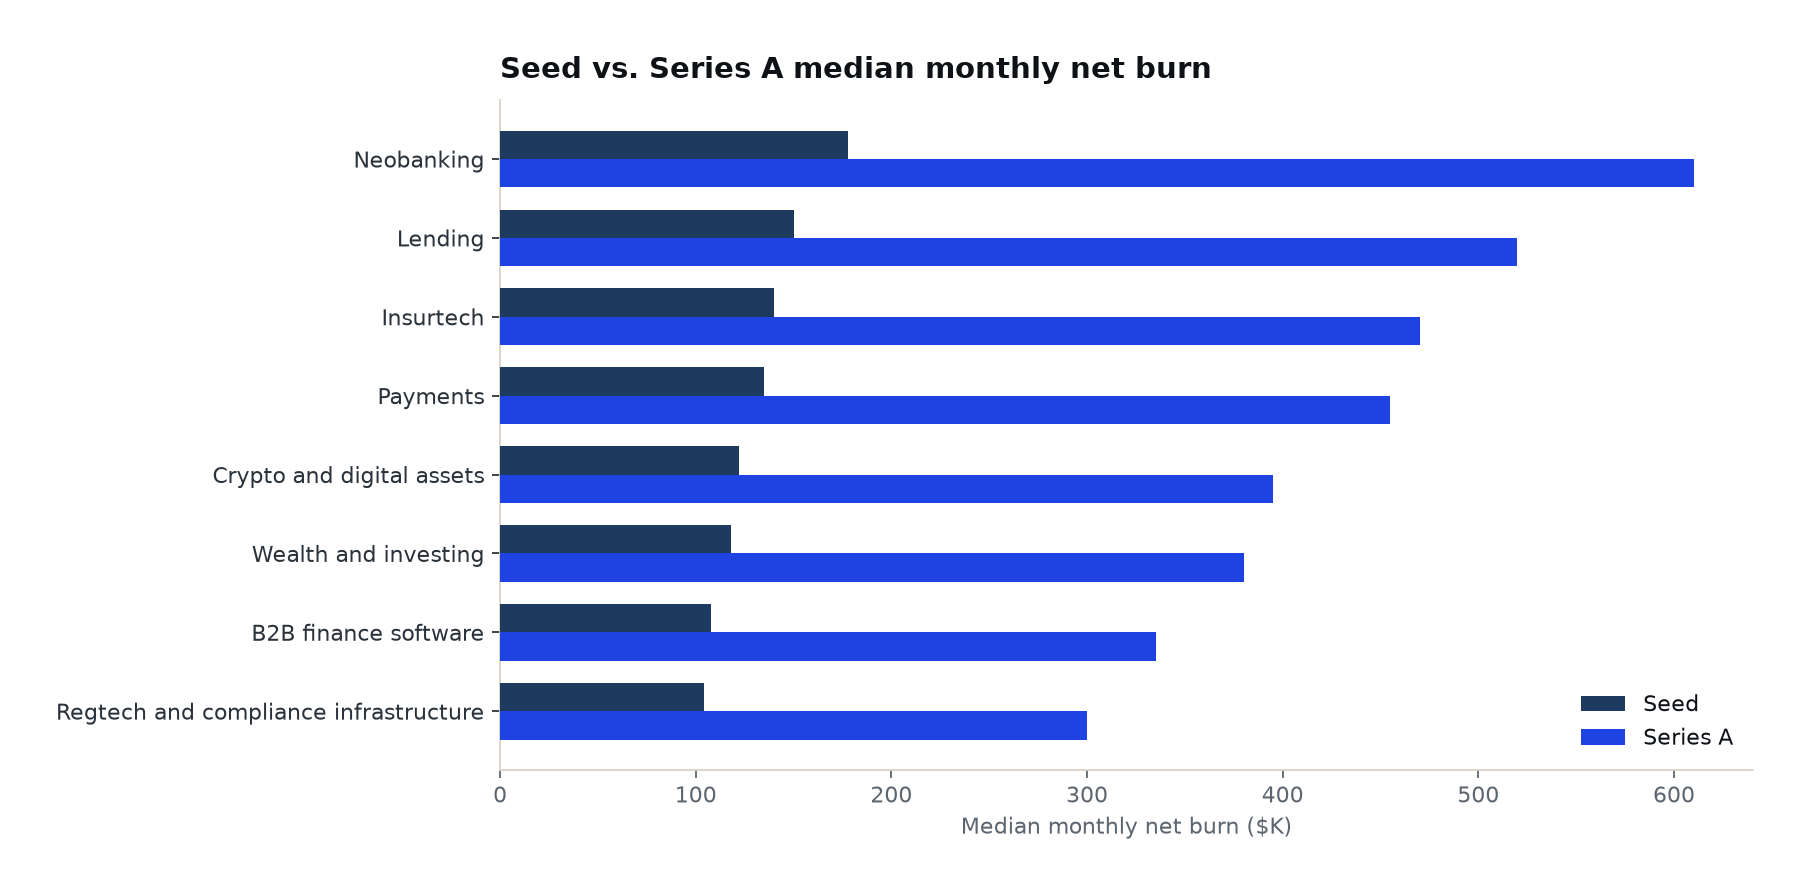
Burn varies widely by business model. In the table below, we compare median monthly net burn at seed and Series A across eight fintech segments, along with each segment's median Series A burn multiple: net burn divided by net new annual recurring revenue, or net new annualized net revenue for transaction-based businesses.
| Segment | Median Seed Monthly Net Burn | Median Series A Monthly Net Burn | Median Series A Burn Multiple |
|---|---|---|---|
| Neobanking | $178K | $610K | 3.6x |
| Lending | $150K | $520K | 2.9x |
| Insurtech | $140K | $470K | 2.7x |
| Payments | $135K | $455K | 2.4x |
| Crypto and digital assets | $122K | $395K | 2.3x |
| Wealth and investing | $118K | $380K | 2.1x |
| B2B finance software | $108K | $335K | 1.6x |
| Regtech and compliance infrastructure | $104K | $300K | 1.5x |
| Segment | Seed | Series A |
|---|---|---|
| Neobanking | $178K | $610K |
| Lending | $150K | $520K |
| Insurtech | $140K | $470K |
| Payments | $135K | $455K |
| Crypto and digital assets | $122K | $395K |
| Wealth and investing | $118K | $380K |
| B2B finance software | $108K | $335K |
| Regtech and compliance infrastructure | $104K | $300K |
- Neobanks burn the most at both stages: $178K per month at seed and $610K at Series A, roughly twice the Series A burn of regtech companies ($300K). Their 3.6x burn multiple is also the highest in the study.
- B2B finance software and regtech run the leanest, both under $340K per month at Series A, with burn multiples of 1.6x and 1.5x.
- Lending ranks second at $520K per month at Series A. Credit risk and capital markets staff, plus warehouse facility costs, arrive well before loan volume is large enough to cover them.
Where Fintech Burn Goes: Spending by Category
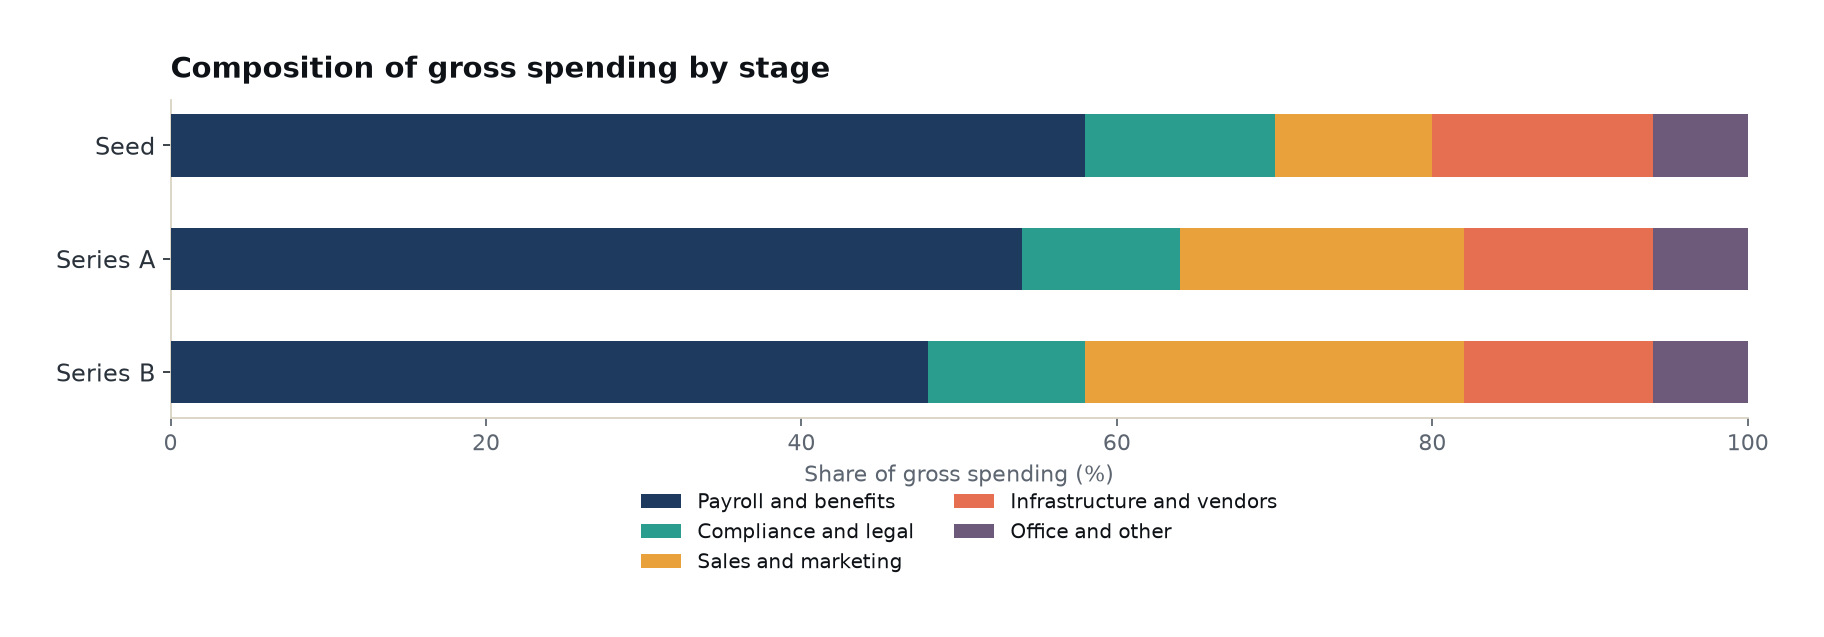
In the table below, we break out gross monthly spending by category for companies at seed, Series A and Series B. Infrastructure and vendors covers cloud hosting, payment processor and partner bank fees, and identity verification.
| Spending Category | Seed | Series A | Series B |
|---|---|---|---|
| Payroll and benefits | 58% | 54% | 48% |
| Compliance and legal | 12% | 10% | 10% |
| Sales and marketing | 10% | 18% | 24% |
| Infrastructure and vendors | 14% | 12% | 12% |
| Office and other | 6% | 6% | 6% |
- Payroll and benefits is the largest line at every stage, but its share falls from 58% of gross spending at seed to 48% at Series B as go-to-market budgets grow.
- Sales and marketing more than doubles its share between seed (10%) and Series B (24%).
- Compliance and legal takes 12% of seed-stage spending, more than sales and marketing at that stage, and holds at 10% through Series A and Series B.
Runway at the Next Raise and Round Outcomes
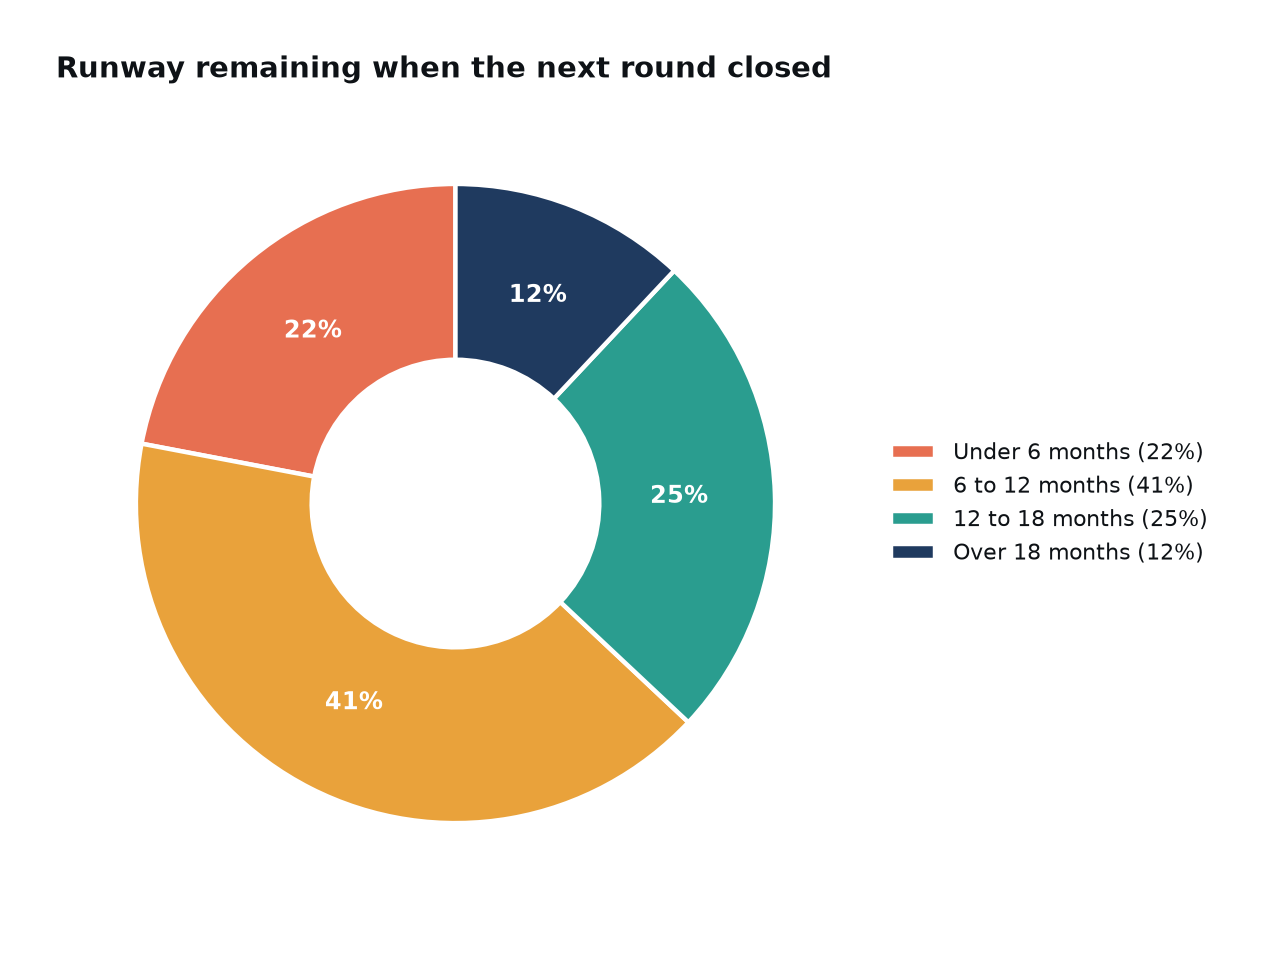
For the 296 companies in our dataset that closed a new priced round, we recorded how many months of runway they had left when the round closed and how the round priced against the prior post-money valuation. The table below shows the results.
| Runway Remaining When Round Closed | Share of Rounds | Median Step-Up vs. Prior Valuation | Share Priced Flat or Down |
|---|---|---|---|
| Under 6 months | 22% | 1.1x | 58% |
| 6 to 12 months | 41% | 1.6x | 34% |
| 12 to 18 months | 25% | 2.2x | 19% |
| Over 18 months | 12% | 2.6x | 11% |
- Companies that raised with less than six months of runway priced flat or down 58% of the time, compared with 11% for companies raising with more than 18 months left.
- 63% of rounds closed with less than 12 months of runway remaining.
- Across all 296 rounds, 33% priced flat or down, about one in three.
Series A Burn Trend, 2022 to 2026
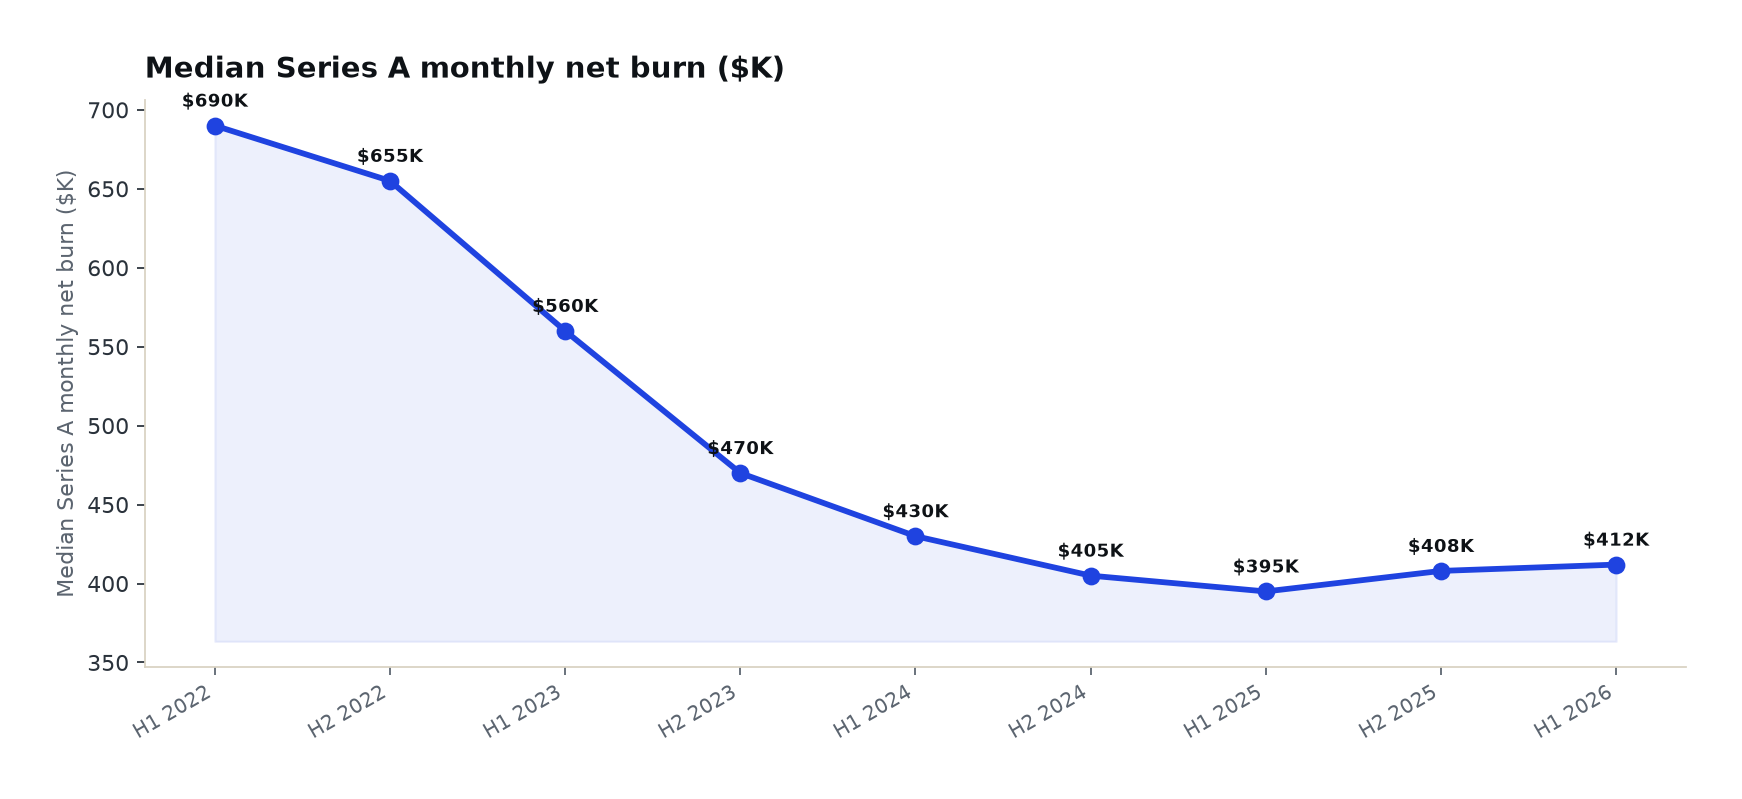
The table below tracks median monthly net burn for Series A fintech companies by half-year, using the companies in our dataset with financial data for each period.
| Period | Median Series A Monthly Net Burn | Change vs. Prior Half |
|---|---|---|
| H1 2022 | $690K | Baseline |
| H2 2022 | $655K | -5.1% |
| H1 2023 | $560K | -14.5% |
| H2 2023 | $470K | -16.1% |
| H1 2024 | $430K | -8.5% |
| H2 2024 | $405K | -5.8% |
| H1 2025 | $395K | -2.5% |
| H2 2025 | $408K | +3.3% |
| H1 2026 | $412K | +1.0% |
- Median Series A burn fell 43% from $690K in H1 2022 to a low of $395K in H1 2025.
- The steepest half-year cut came in H2 2023, when median burn dropped 16.1%.
- Burn has risen in each of the last two half-years, reaching $412K in H1 2026, as Series A companies resumed hiring in sales and compliance.
Burn Efficiency and the Odds of Raising Again
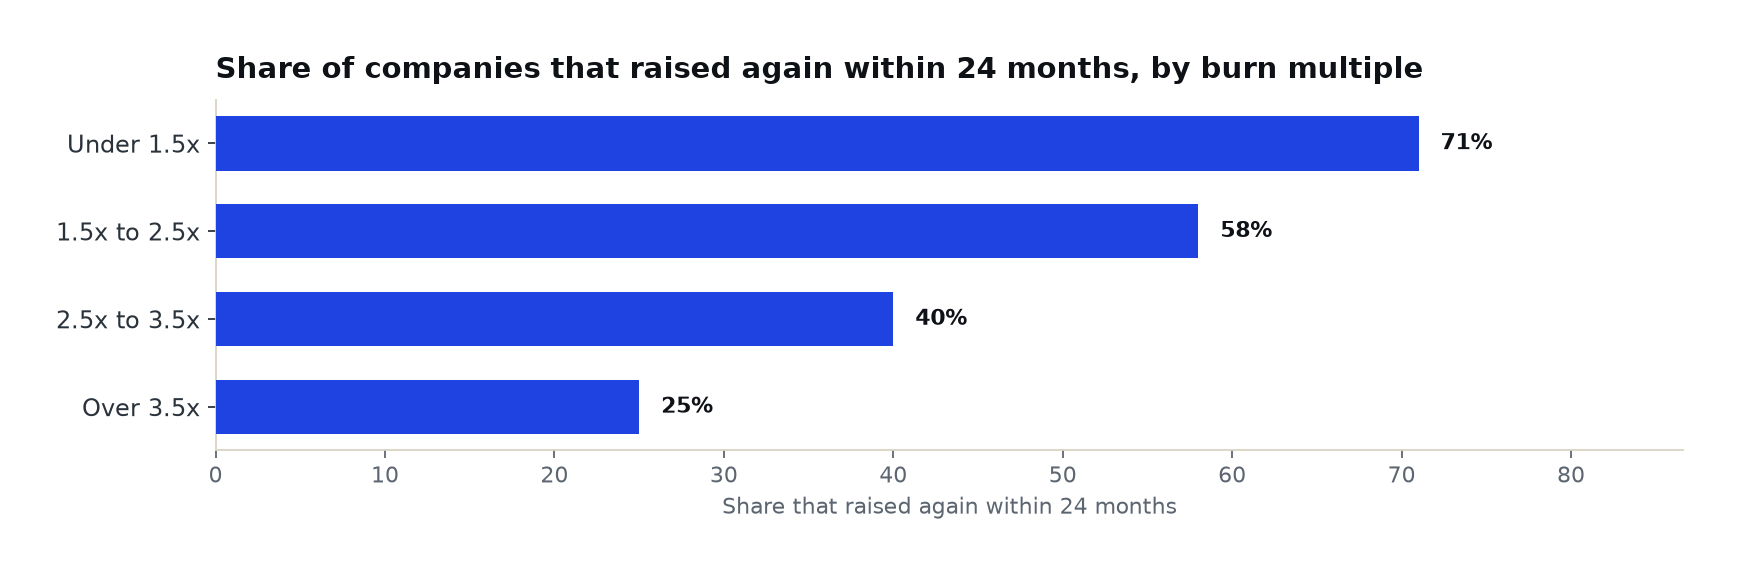
We grouped companies by their burn multiple at the start of a 24-month observation period and tracked how many closed another priced round before the period ended. The results are in the table below.
Burn Multiple and Fundraising Outcomes, 2026
| Burn Multiple | Share of Companies | Raised Another Priced Round Within 24 Months | Median Months to Next Round |
|---|---|---|---|
| Under 1.5x | 21% | 71% | 16 |
| 1.5x to 2.5x | 38% | 58% | 19 |
| 2.5x to 3.5x | 27% | 40% | 23 |
| Over 3.5x | 14% | 25% | 27 |
| Burn Multiple | Share That Raised Again Within 24 Months |
|---|---|
| Under 1.5x | 71% |
| 1.5x to 2.5x | 58% |
| 2.5x to 3.5x | 40% |
| Over 3.5x | 25% |
- Companies with a burn multiple under 1.5x raised again 71% of the time, nearly three times the rate of companies above 3.5x (25%).
- The largest drop sits between the 1.5x to 2.5x band and the 2.5x to 3.5x band, where the share that raised again falls 18 points.
- 41% of the companies we tracked were operating above a 2.5x burn multiple at the start of the period.
Sources
- Pulse of Fintech H1 2026. KPMG International, August 2026.
- European Fintech Startup Funding, H1 2026. Tech.eu, July 2026.
- Down Rounds Are About 20 Percent of All VC Rounds. Carta, October 2024.
- The Fintech Entrepreneur's Guide to Creating Enterprise Value Starts with Contribution Profit. Bessemer Venture Partners, September 2024.