Fintech IPO Statistics: 2026 Report

Our analysts reviewed 2,920 US IPO records from 2019 through October 2026, the share prices of 11 fintech companies that went public on US exchanges in 2025 and 2026, and the 16 publicly traded companies among the 93 rated on The Fintech Index, to understand where fintech IPOs stand as of Q4 2026.
Key Findings
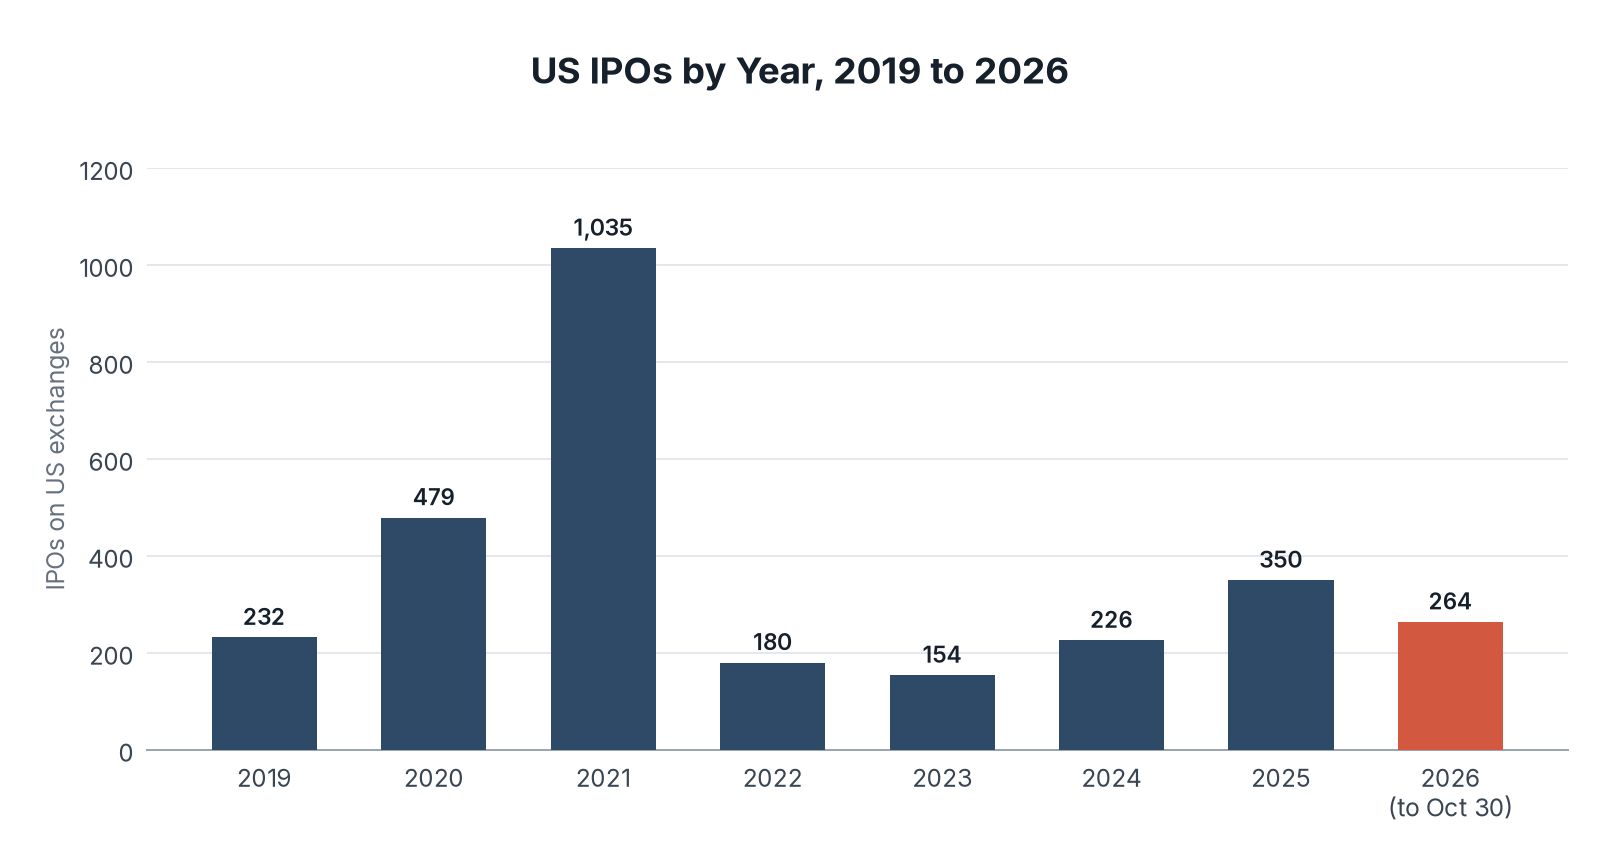
- US exchanges hosted 350 IPOs in 2025, the most since 2021, and 264 in 2026 through October 30.
- Of 11 fintech companies that went public in the US in 2025 and 2026, only Circle and Chime traded higher than their IPO price on October 30, 2026.
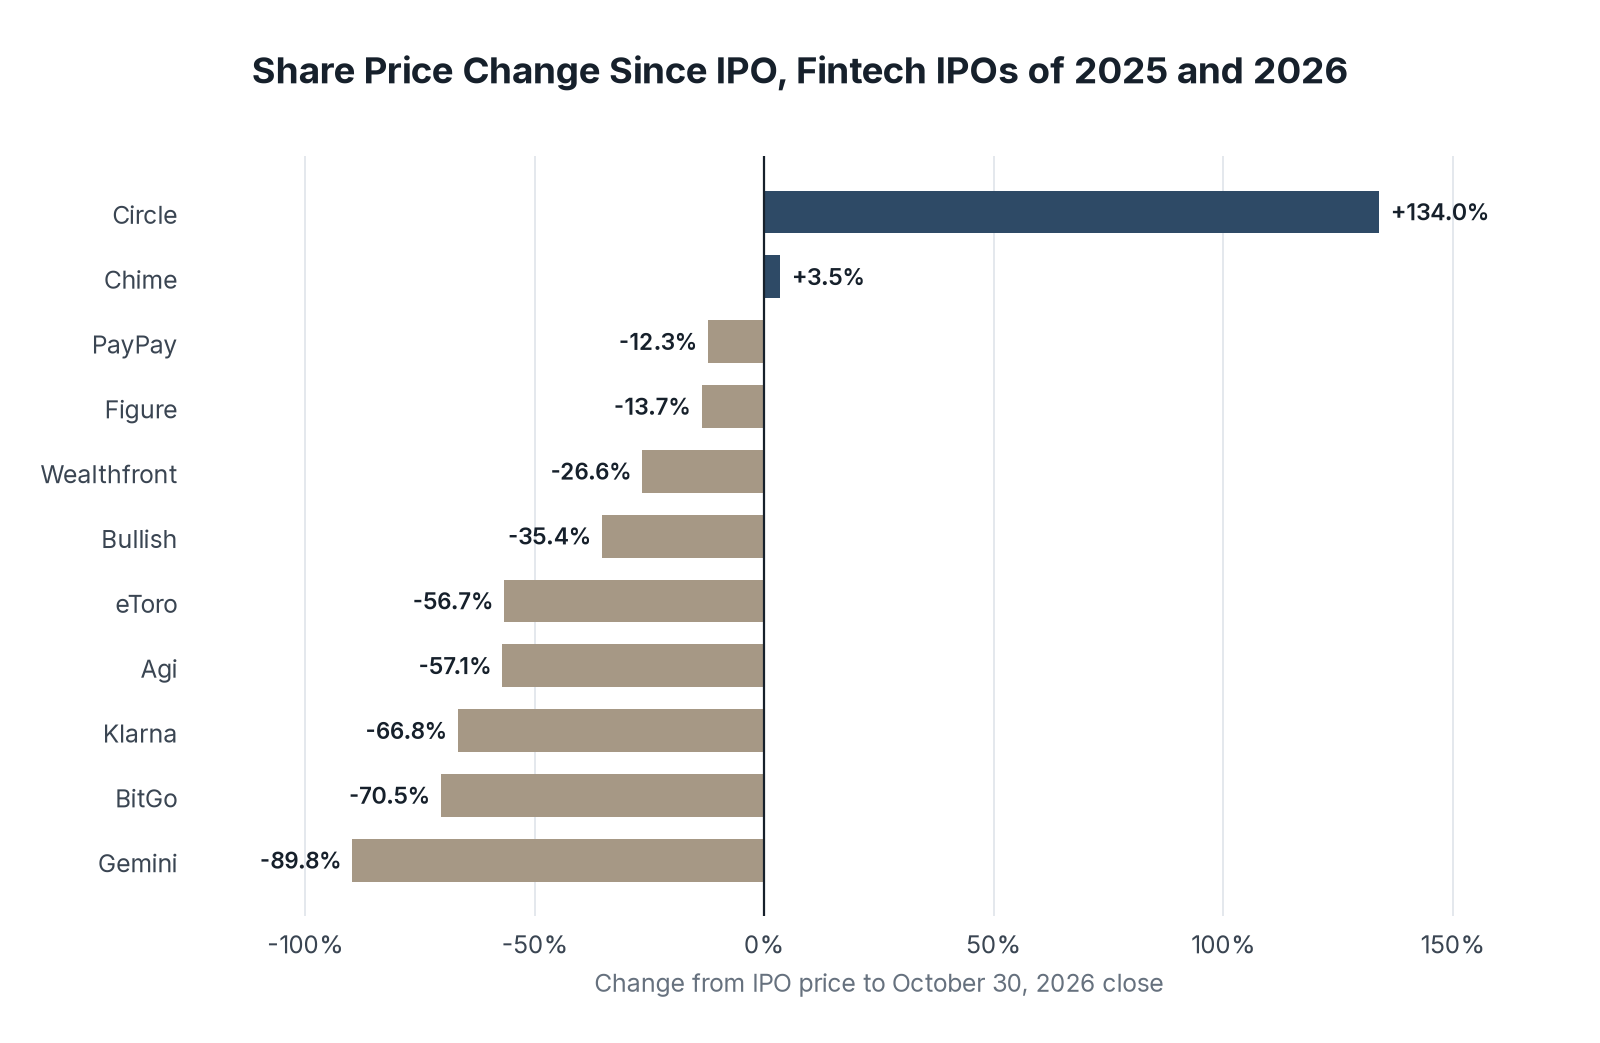
- The median fintech IPO of 2025 and 2026 was down 35.4% from its IPO price, with results ranging from a 134.0% gain at Circle to an 89.8% loss at Gemini.
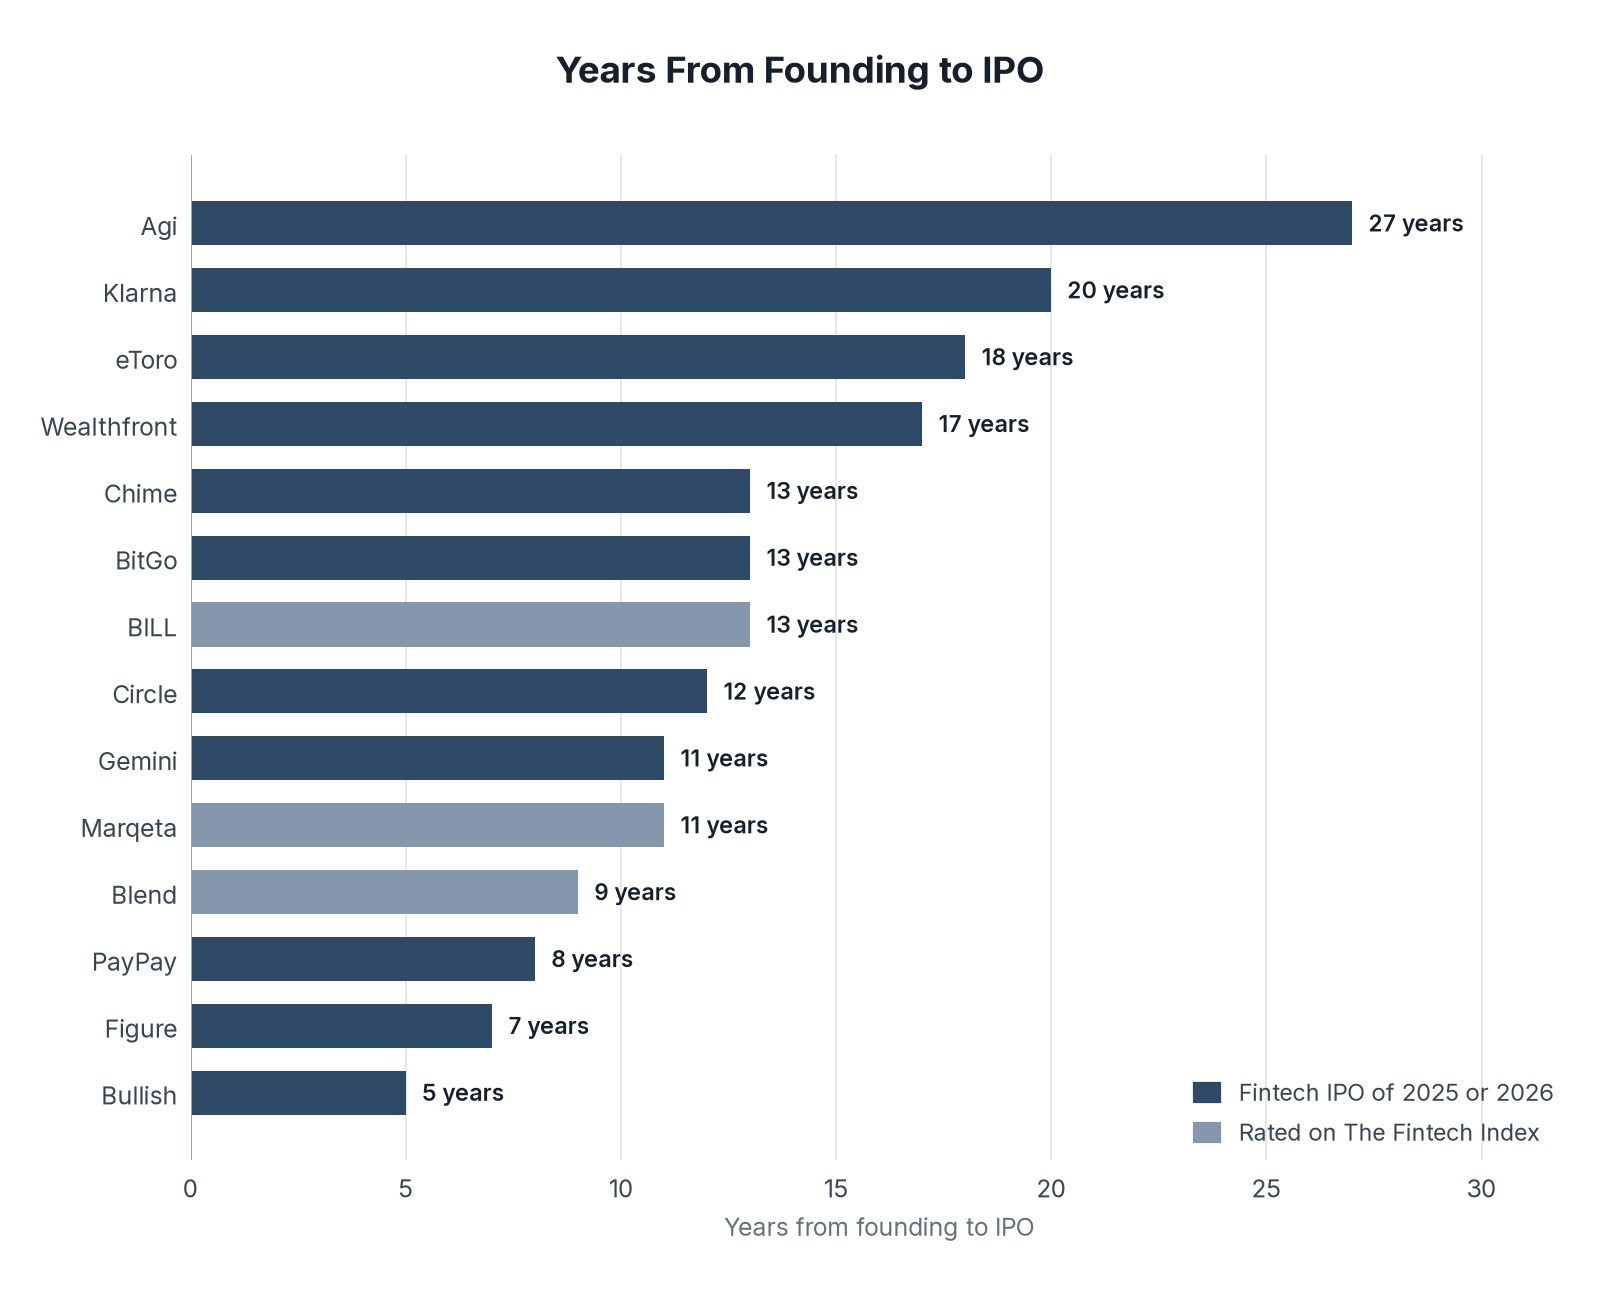
- These companies took a median of 13 years to go from founding to IPO, from 5 years at Bullish to 27 years at Agi.
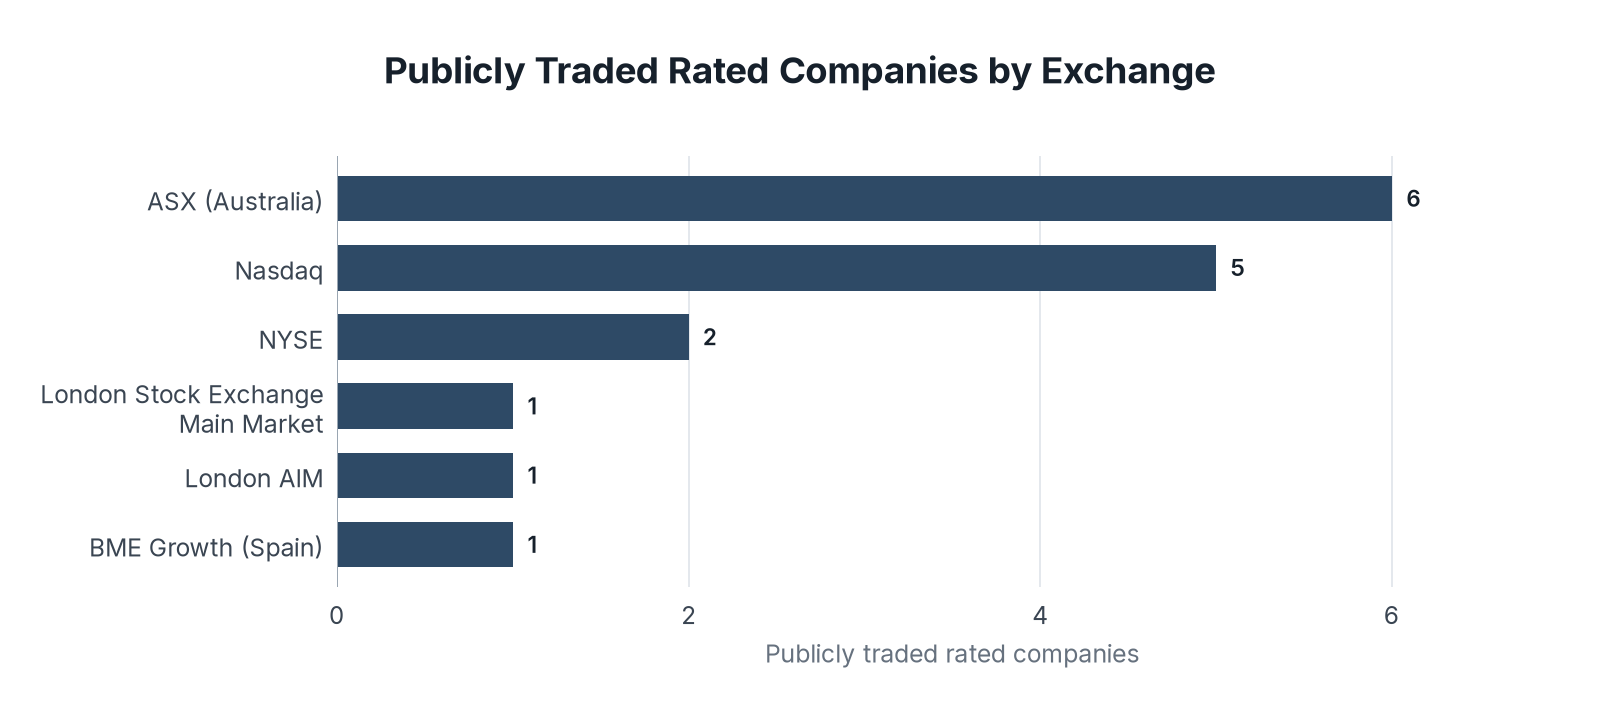
- Of the 93 companies rated on The Fintech Index, 16 are publicly traded, and 6 of those trade on the Australian Securities Exchange.
An initial public offering, or IPO, is the first sale of a company's shares to the public on a stock exchange. For a fintech company, it is how early investors and employees can sell shares and how the business raises money in the public market. After US IPO counts fell to 180 in 2022 and 154 in 2023, large fintech companies such as Chime, Klarna, and Circle went public in 2025, and the question for investors and customers now is how those shares have held up.
We counted US IPOs by year from StockAnalysis.com's IPO statistics, then took the IPO price and the October 30, 2026 closing price for each fintech company that went public on a US exchange from January 2025 through October 2026. We also reviewed how the publicly traded companies we rate came to market and where they trade.
In the following sections, we compare US IPO counts by year, share price changes for recent fintech IPOs, the years each company took to go public, the share prices of rated companies that went public in the US, and the exchanges where rated companies trade.
US IPO Counts Have Recovered To Their Highest Level Since 2021
The number of companies going public in a year is the clearest sign of whether the IPO market is open. We gathered the annual count of IPOs on US exchanges from 2019 through October 30, 2026, which includes all sectors and special purpose acquisition companies.
| Year | IPOs on US exchanges | Change from prior year |
|---|---|---|
| 2019 | 232 | No prior year in this data |
| 2020 | 479 | +106.5% |
| 2021 | 1,035 | +116.1% |
| 2022 | 180 | -82.6% |
| 2023 | 154 | -14.4% |
| 2024 | 226 | +46.8% |
| 2025 | 350 | +54.9% |
| 2026, through October 30 | 264 | Partial year |
Key Findings
- The 2021 count of 1,035 IPOs was a record, and the count fell 82.6% to 180 in 2022 and reached its low of 154 in 2023.
- 2025 brought 350 IPOs, up 54.9% from 2024, and the year included the US debuts of eToro, Circle, Chime, Klarna, and Gemini.
- With 264 IPOs through October 30, 2026 is on pace for about 318 for the full year, close to the 2025 total.
Most Fintech IPOs Of 2025 And 2026 Trade Under Their IPO Price
A strong first day of trading gets the headlines, but the share price months later shows what public investors think the company is worth. We gathered the IPO price and the October 30, 2026 closing price for the 11 technology-led financial services companies that went public on US exchanges from January 2025 through October 2026.
| Company | Business | IPO date | IPO price | Close on Oct 30, 2026 | Change since IPO |
|---|---|---|---|---|---|
| Circle | Stablecoins and payments | Jun 5, 2025 | $31.00 | $72.54 | +134.0% |
| Chime | Consumer banking | Jun 12, 2025 | $27.00 | $27.95 | +3.5% |
| PayPay | Mobile payments, Japan | Mar 12, 2026 | $16.00 | $14.03 | -12.3% |
| Figure | Blockchain-based lending | Sep 11, 2025 | $25.00 | $21.58 | -13.7% |
| Wealthfront | Automated investing | Dec 12, 2025 | $14.00 | $10.27 | -26.6% |
| Bullish | Digital asset exchange | Aug 13, 2025 | $37.00 | $23.90 | -35.4% |
| eToro | Trading and investing | May 14, 2025 | $52.00 | $22.51 | -56.7% |
| Agi | Digital banking and lending, Brazil | Feb 11, 2026 | $12.00 | $5.15 | -57.1% |
| Klarna | Buy now, pay later and banking | Sep 10, 2025 | $40.00 | $13.30 | -66.8% |
| BitGo | Digital asset custody | Jan 22, 2026 | $18.00 | $5.31 | -70.5% |
| Gemini | Crypto exchange | Sep 12, 2025 | $28.00 | $2.87 | -89.8% |
Key Findings
- An investor who put $1,000 into each of the 11 IPOs at the IPO price would have had about $8,090 on October 30, 2026, a loss of about 26.5%, and most of what remained came from Circle.
- Four of the 11 companies, Circle, Bullish, Gemini, and BitGo, are digital asset businesses. Circle is the best performer, while the other three are among the six weakest.
- Chime was 3.5% over its $27.00 IPO price, while Klarna traded at about a third of its $40.00 IPO price.
Fintech Companies Took A Median Of 13 Years To Go Public
The time between founding and an IPO shows how long investors and employees wait before they can sell shares on the open market. We gathered the founding year and IPO year for each fintech IPO of 2025 and 2026 and for the three companies rated on The Fintech Index that went public in the US through a traditional IPO since 2019.
| Company | Founded | IPO year | Years from founding to IPO | Group |
|---|---|---|---|---|
| Agi | 1999 | 2026 | 27 | Fintech IPO of 2025 or 2026 |
| Klarna | 2005 | 2025 | 20 | Fintech IPO of 2025 or 2026 |
| eToro | 2007 | 2025 | 18 | Fintech IPO of 2025 or 2026 |
| Wealthfront | 2008 | 2025 | 17 | Fintech IPO of 2025 or 2026 |
| Chime | 2012 | 2025 | 13 | Fintech IPO of 2025 or 2026 |
| BitGo | 2013 | 2026 | 13 | Fintech IPO of 2025 or 2026 |
| BILL | 2006 | 2019 | 13 | Rated on The Fintech Index |
| Circle | 2013 | 2025 | 12 | Fintech IPO of 2025 or 2026 |
| Gemini | 2014 | 2025 | 11 | Fintech IPO of 2025 or 2026 |
| Marqeta | 2010 | 2021 | 11 | Rated on The Fintech Index |
| Blend | 2012 | 2021 | 9 | Rated on The Fintech Index |
| PayPay | 2018 | 2026 | 8 | Fintech IPO of 2025 or 2026 |
| Figure | 2018 | 2025 | 7 | Fintech IPO of 2025 or 2026 |
| Bullish | 2020 | 2025 | 5 | Fintech IPO of 2025 or 2026 |
Key Findings
- The median time from founding to IPO was 13 years for the 11 fintech IPOs of 2025 and 2026, and 11 years for the three rated companies that went public in 2019 and 2021.
- Klarna and eToro each waited 18 years or more, and both trade at less than half of their IPO price, so a long private life did not protect their public shares.
- Bullish and Figure went public within 7 years of founding, the fastest in the group, and both trade under their IPO prices.
Rated Companies That Went Public Show Mixed Results
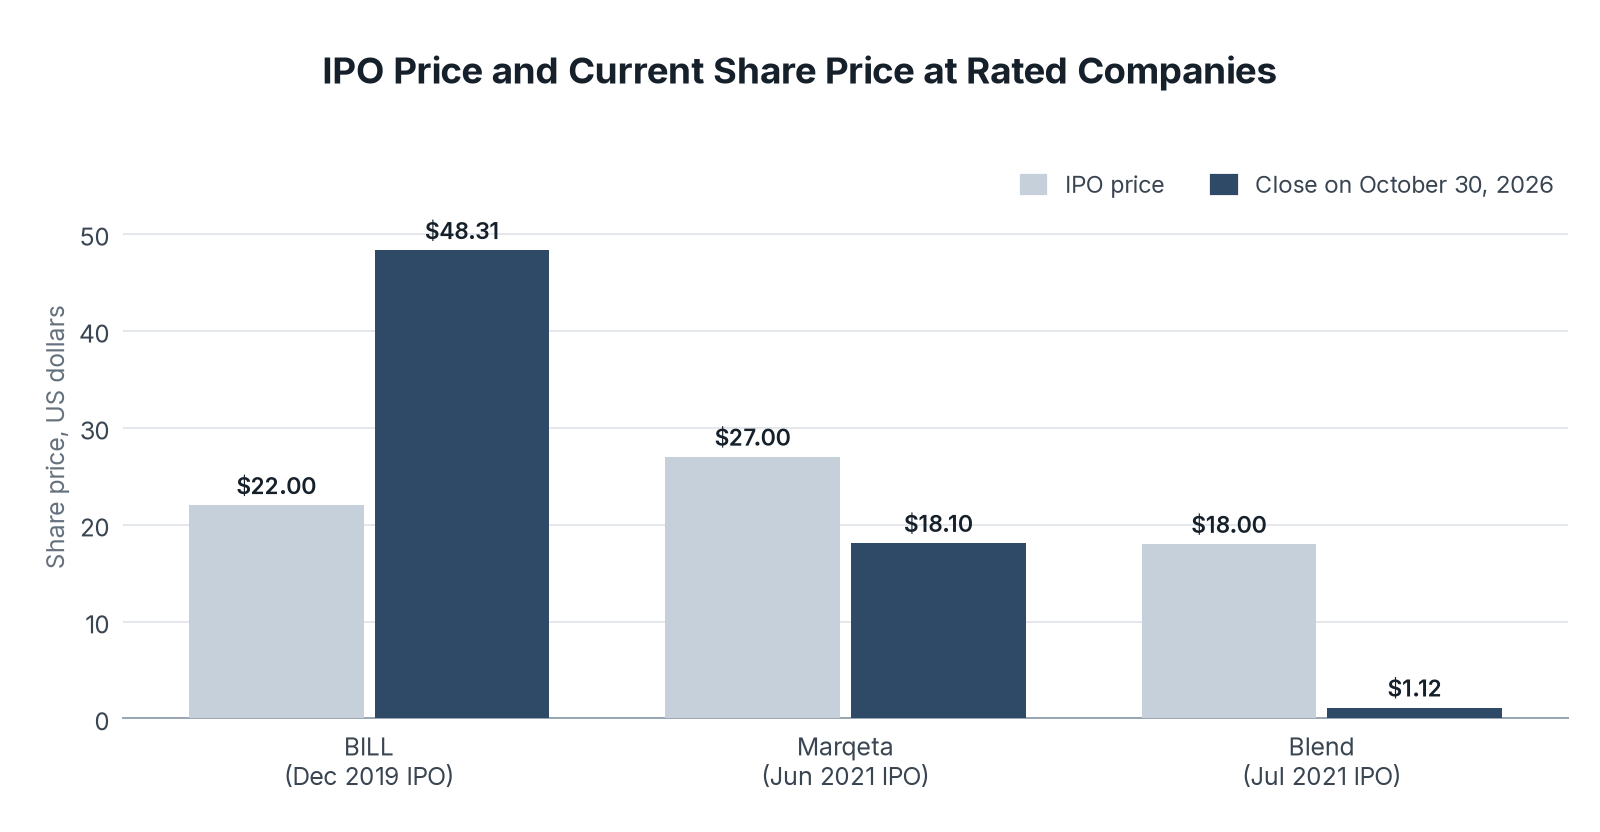
Three companies rated on The Fintech Index went public on US exchanges through a traditional IPO since 2019, and their share prices now show how the market has valued each one over several years. We gathered each company's IPO price, its October 30, 2026 closing price, and its market value on that date.
| Company | Exchange | IPO date | IPO price | Close on Oct 30, 2026 | Change since IPO | Market value | Fintech Index rating |
|---|---|---|---|---|---|---|---|
| BILL | NYSE | Dec 12, 2019 | $22.00 | $48.31 | +119.6% | $4.12B | 84 |
| Marqeta | Nasdaq | Jun 9, 2021 | $27.00 | $18.10 | -33.0% | $1.88B | 74 |
| Blend | NYSE | Jul 16, 2021 | $18.00 | $1.12 | -93.8% | $264.9M | 76 |
Key Findings
- BILL, which went public in December 2019 before the 2021 peak, is the only one of the three trading over its IPO price, at more than twice its $22.00 offer.
- Marqeta and Blend both went public in mid-2021, when US IPO counts hit their record, and both trade under their IPO prices.
- Share price and our rating measure different things: Blend is down 93.8% since its IPO but rates 76, two points over Marqeta, because our rating scores the product and terms a buyer gets, not the stock.
Most Publicly Traded Rated Companies Trade Outside The US
Where a company trades shapes its disclosure rules and how easily buyers can find its financial results. We counted the publicly traded companies among the 93 rated on The Fintech Index and grouped them by exchange, along with their average rating.
| Exchange | Rated companies | Count | Average Fintech Index rating |
|---|---|---|---|
| ASX (Australia) | Beforepay, Butn, Change Financial, Earlypay, Raiz, Spenda | 6 | 72.0 |
| Nasdaq | Dave, Intellicheck, Interactive Brokers, Marqeta, Mitek | 5 | 75.0 |
| NYSE | BILL, Blend | 2 | 80.0 |
| London Stock Exchange Main Market | Funding Circle | 1 | 79.0 |
| London AIM | PCI-PAL | 1 | 70.0 |
| BME Growth (Spain) | Facephi | 1 | 74.0 |
Key Findings
- Of the 93 rated companies, 16, or 17.2%, are publicly traded, and 9 of the 16 trade outside the US.
- The 16 publicly traded companies average a rating of 74.4, against 76.0 for the 77 private companies we rate.
- Dave came to Nasdaq through a merger with a special purpose acquisition company in January 2022, so it has no IPO price and is not part of the rated IPO table.
What Fintech IPO Results Mean For Investors And Customers In 2026
The US IPO market has reopened, with 350 IPOs in 2025 and 264 through October 30, 2026, and fintech companies have used it. But nine of the 11 fintech companies that went public in 2025 and 2026 traded under their IPO price at the end of October 2026, and the median was down 35.4%. A successful IPO gave these companies cash and a public profile, not a guarantee of a rising share price.
If US IPO counts hold near 2025 levels, more large private fintech companies are likely to try the public market in 2027. The results so far show investors separating companies sharply: Circle and BILL trade well over their IPO prices, while Gemini, BitGo, and Blend have lost 70% or more.
So if you are choosing a fintech provider that recently went public, read its quarterly results for revenue growth and losses, not its share price.
Data Collection and Methodology
We counted IPOs on US exchanges by year from StockAnalysis.com's IPO statistics, which cover all sectors and include special purpose acquisition companies. The 2,920 IPO records are the annual totals from 2019 through October 30, 2026. The 2026 full-year pace is our calculation from the count through October 30.
We defined a fintech IPO as a technology-led financial services company, covering payments, consumer banking, lending, investing, and digital assets, whose shares began trading on the NYSE or Nasdaq from January 1, 2025 through October 30, 2026. We reviewed StockAnalysis.com's 2025 and 2026 IPO lists and each company's profile to select 11 companies. We excluded insurance companies, traditional banks, special purpose acquisition companies, and Navan, a travel and expense software company. Agi is Agi Inc., a Brazilian financial services company. Prices are the IPO price and the closing price on October 30, 2026, in US dollars, not adjusted for dividends.
Years from founding to IPO are the IPO year minus the founding year in each company's StockAnalysis.com profile. The $1,000 example is our calculation from the price changes. Market value is as StockAnalysis.com reported it on October 30, 2026.
The rated company figures come from our review pages as of November 2, 2026. We counted a company as publicly traded if its shares trade on a public exchange, and grouped Facephi under BME Growth, its main market, though it also trades on Euronext Growth Paris. The Fintech Index rating is the rounded average of the eight criterion scores on each company's review page. These are public-company figures. All figures are in US dollars, and no currency conversion was needed.
Sources
- The Fintech Index analysis of the 16 publicly traded companies among 93 rated companies, conducted November 2026
- StockAnalysis.com, IPO Statistics
- StockAnalysis.com, 2025 IPOs
- StockAnalysis.com, 2026 IPOs
- StockAnalysis.com, company profiles for Circle, Chime, PayPay, Figure, Wealthfront, Bullish, eToro, Agi, Klarna, BitGo, and Gemini
- StockAnalysis.com, company profiles and quotes for BILL, Marqeta, and Blend
- BILL, Fiscal Fourth Quarter and Fiscal Year 2026 Financial Results
- CNBC, Mark Cuban-backed Dave begins trading on Nasdaq after completing SPAC, January 6, 2022
- Table, US IPOs by Year: Source: StockAnalysis.com, IPO Statistics (Source 2), as of November 2, 2026. Data: us_ipos_by_year.csv
- Chart, US IPOs by Year: Source: StockAnalysis.com, IPO Statistics. Counts cover all sectors and include special purpose acquisition companies.
- Table, Fintech IPOs on US Exchanges, 2025 and 2026: Source: StockAnalysis.com, 2025 and 2026 IPO lists and company profiles (Sources 3 to 5), closing prices on October 30, 2026. Data: fintech_ipos_2025_2026.csv
- Chart, Fintech IPOs on US Exchanges, 2025 and 2026: Source: StockAnalysis.com, 2025 and 2026 IPO lists and company profiles.
- Table, Years From Founding to IPO: Source: StockAnalysis.com company profiles (Sources 5 and 6), and The Fintech Index analysis of rated companies (Source 1). Data: years_to_ipo.csv
- Chart, Years From Founding to IPO: Source: StockAnalysis.com company profiles and The Fintech Index analysis of rated companies.
- Table, IPO Price and Current Share Price at Rated Companies: Source: The Fintech Index analysis of rated companies (Source 1), with IPO and price data from StockAnalysis.com (Source 6). Data: rated_company_ipos.csv
- Chart, IPO Price and Current Share Price at Rated Companies: Source: The Fintech Index analysis of rated companies, with price data from StockAnalysis.com.
- Table, Publicly Traded Rated Companies by Exchange: Source: The Fintech Index analysis of rated companies (Source 1), as of November 2, 2026. Data: rated_public_companies.csv
- Chart, Publicly Traded Rated Companies by Exchange: Source: The Fintech Index analysis of rated companies.