Fintech Gross Margin Benchmarks: 2026 Report
Gross and contribution margin across 318 private fintech companies, restated on one cost-of-revenue definition by segment, size, revenue model, and year.
This report looks at gross margin across 318 private fintech companies with at least $5 million in annual revenue. Gross margin here means the share of revenue left after the direct costs of delivering a product. Fintech gross margins are hard to compare because companies count different costs above the line. A payments company may report revenue net of card network fees, while a lender may leave credit losses out of cost of revenue entirely. We restated every company on one definition, in which cost of revenue includes network and processing fees, credit and fraud losses, funding costs, customer support, per-customer compliance and verification, and hosting. We also calculated contribution margin after sales commissions, rewards and other variable costs. On that basis, the median fintech gross margin is 57%.
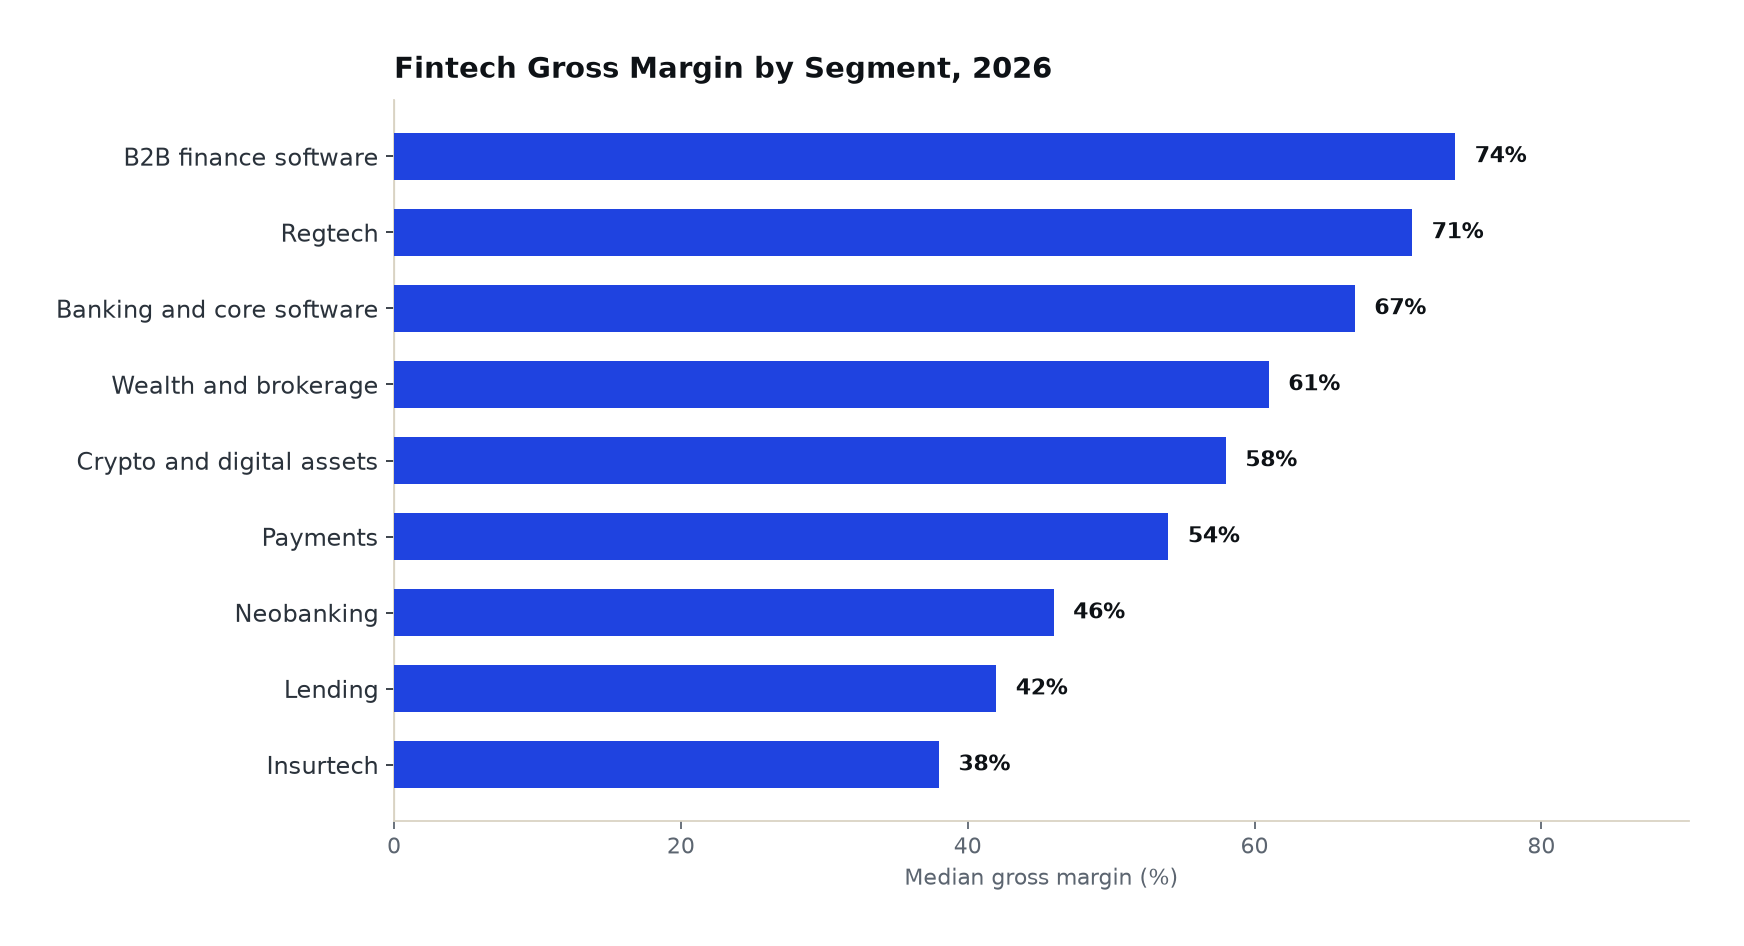
Median Gross Margin by Fintech Segment
The table below shows median gross margin by segment along with the 25th and 75th percentile values, which mark the range for the middle half of companies in each segment.
| Segment | Companies Analyzed | 25th Percentile | Median Gross Margin | 75th Percentile |
|---|---|---|---|---|
| B2B finance software | 52 | 66% | 74% | 81% |
| Regtech | 29 | 63% | 71% | 79% |
| Banking and core software | 31 | 58% | 67% | 75% |
| Wealth and brokerage | 34 | 49% | 61% | 70% |
| Crypto and digital assets | 27 | 44% | 58% | 69% |
| Payments | 58 | 41% | 54% | 64% |
| Neobanking | 33 | 35% | 46% | 57% |
| Lending | 36 | 31% | 42% | 53% |
| Insurtech | 18 | 27% | 38% | 49% |
- B2B finance software leads at a median 74% gross margin, 36 points above insurtech at 38%.
- Payments posts 54%, below the overall median of 57%, because network and processing fees remain in cost of revenue under our common definition.
- Crypto shows the widest spread, 25 points between the 25th and 75th percentile, because trading revenue and its margins move with market cycles.
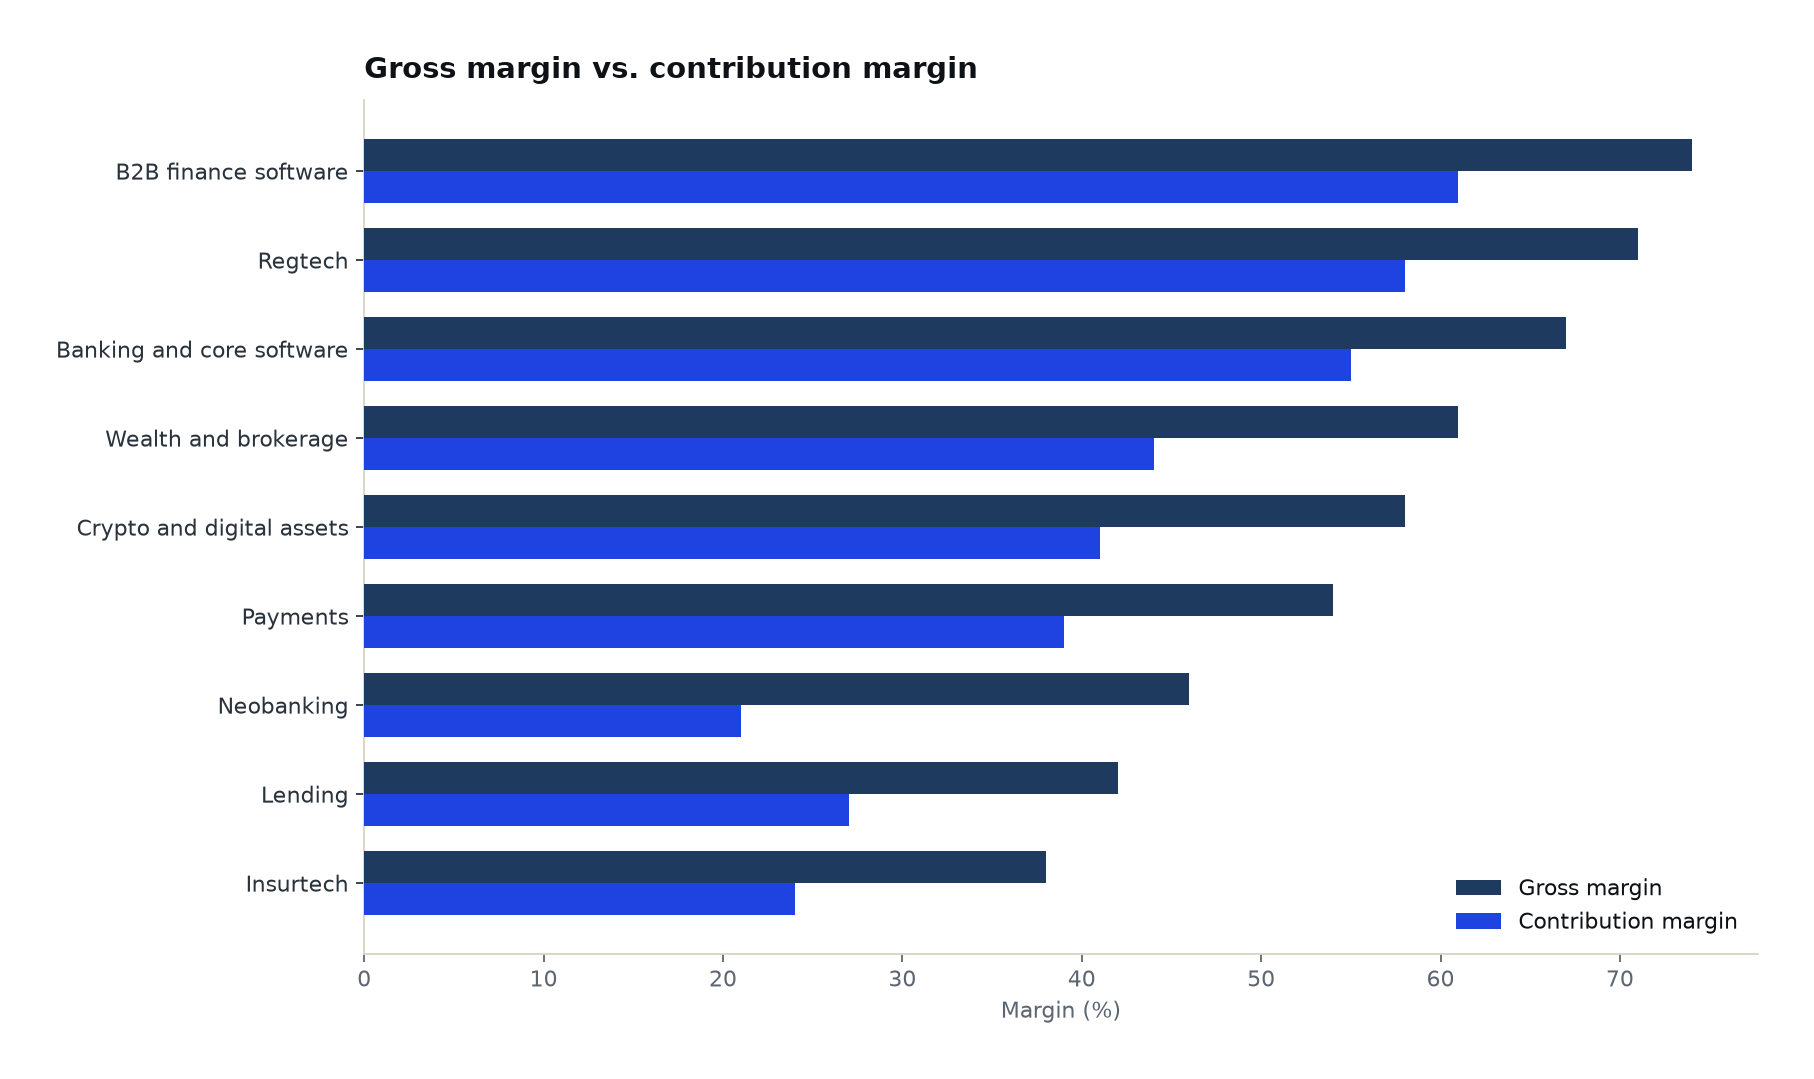
Gross Margin vs. Contribution Margin
Gross margin leaves out several costs that grow with every new customer. In the table below, we compare median gross margin with median contribution margin, which also subtracts sales commissions, customer rewards, promotional rates and other variable costs.
| Segment | Median Gross Margin | Median Contribution Margin | Gap |
|---|---|---|---|
| B2B finance software | 74% | 61% | 13 pts |
| Regtech | 71% | 58% | 13 pts |
| Banking and core software | 67% | 55% | 12 pts |
| Wealth and brokerage | 61% | 44% | 17 pts |
| Crypto and digital assets | 58% | 41% | 17 pts |
| Payments | 54% | 39% | 15 pts |
| Neobanking | 46% | 21% | 25 pts |
| Lending | 42% | 27% | 15 pts |
| Insurtech | 38% | 24% | 14 pts |
| Segment | Gross Margin | Contribution Margin |
|---|---|---|
| B2B finance software | 74% | 61% |
| Regtech | 71% | 58% |
| Banking and core software | 67% | 55% |
| Wealth and brokerage | 61% | 44% |
| Crypto and digital assets | 58% | 41% |
| Payments | 54% | 39% |
| Neobanking | 46% | 21% |
| Lending | 42% | 27% |
| Insurtech | 38% | 24% |
- Neobanking has the widest gap at 25 points, as card rewards, account bonuses and promotional deposit rates come out of every new account.
- Banking and core software has the narrowest gap at 12 points, and none of the three software segments loses more than 13 points.
- Only three segments keep a contribution margin above 50%: B2B finance software (61%), regtech (58%) and banking and core software (55%).
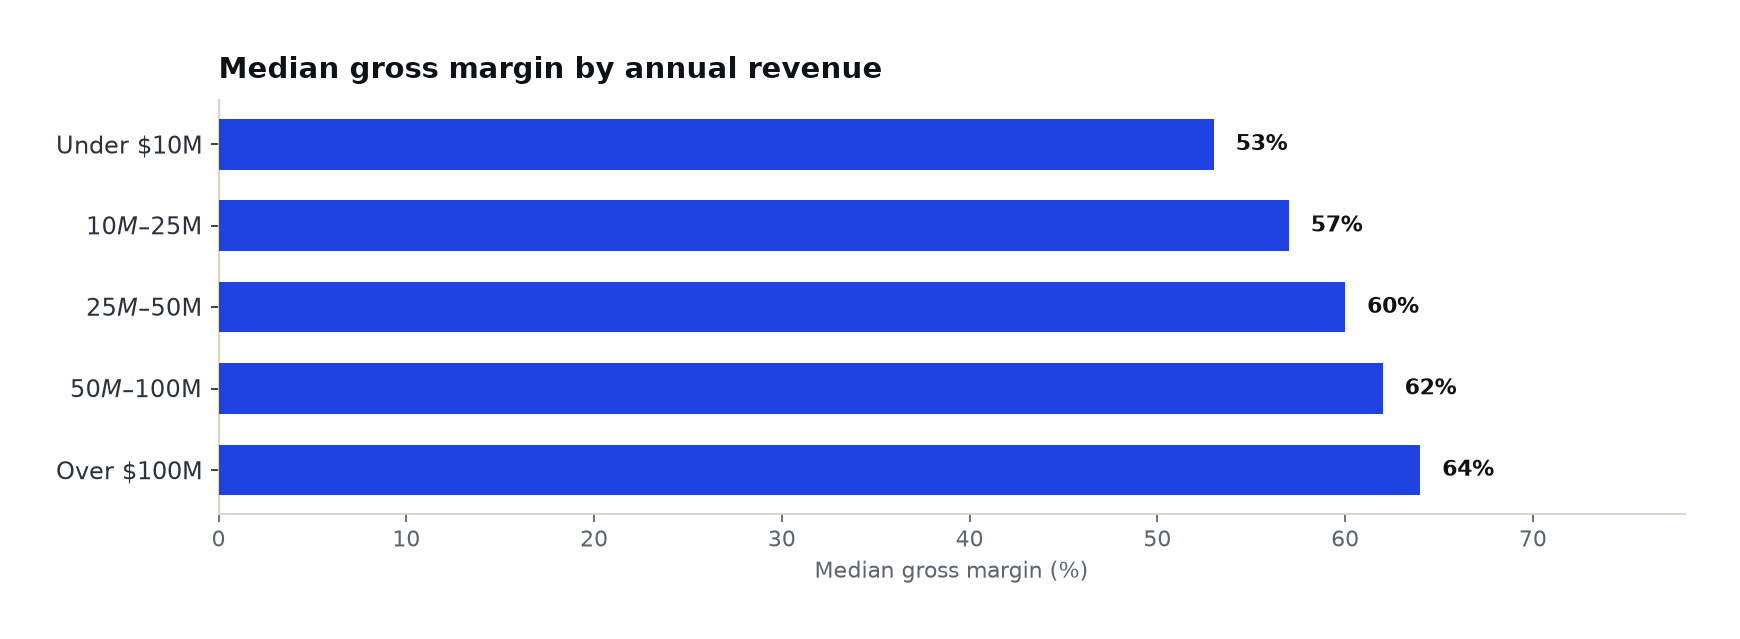
Gross Margin by Company Size
The table below shows how median gross margin changes as fintech companies grow, measured by annual revenue.
| Annual Revenue | Companies Analyzed | Median Gross Margin |
|---|---|---|
| Under $10M | 96 | 53% |
| $10M-$25M | 88 | 57% |
| $25M-$50M | 61 | 60% |
| $50M-$100M | 41 | 62% |
| Over $100M | 32 | 64% |
- Median gross margin rises 11 points from companies under $10 million in revenue (53%) to companies above $100 million (64%).
- The largest step comes between the first two bands, 4 points, as companies renegotiate processor and verification pricing at higher volume.
- Above $25 million in revenue, gains slow to about two points per band.
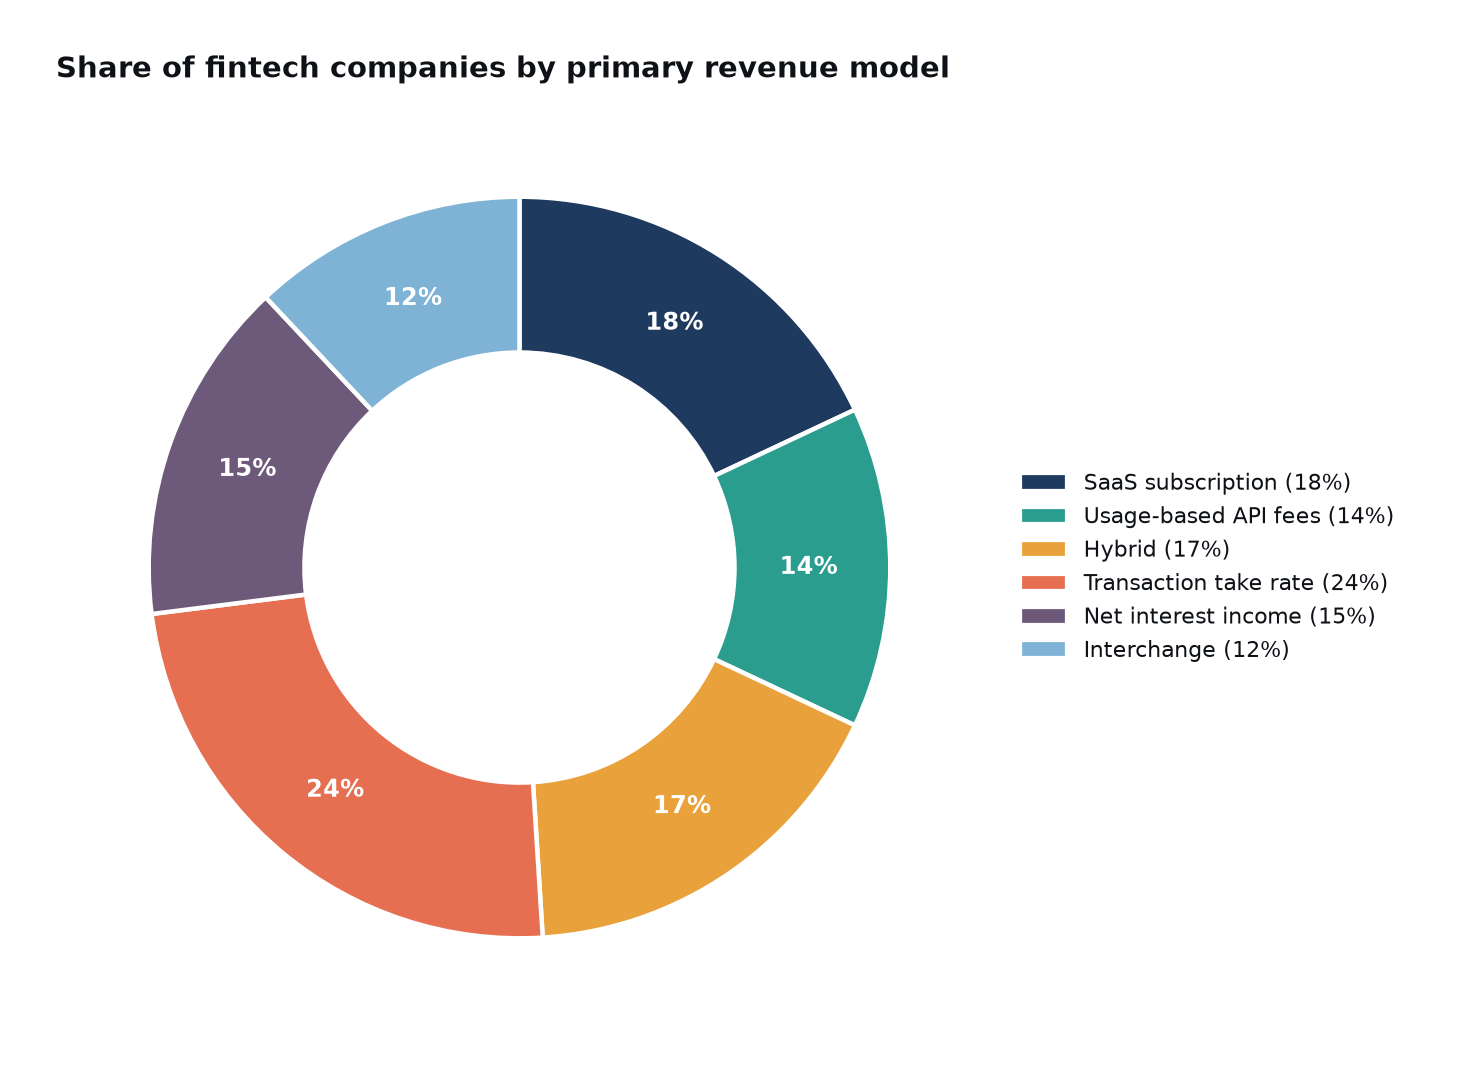
Gross Margin by Revenue Model
Many fintechs earn revenue in more than one way. The table below groups companies by the revenue model that produces the majority of their revenue, with hybrid covering companies where no single model exceeds half.
| Primary Revenue Model | Share of Companies | Median Gross Margin |
|---|---|---|
| SaaS subscription | 18% | 76% |
| Usage-based API fees | 14% | 64% |
| Hybrid | 17% | 58% |
| Transaction take rate | 24% | 49% |
| Net interest income | 15% | 47% |
| Interchange | 12% | 44% |
- SaaS subscription businesses earn the highest median gross margin at 76%, 32 points above interchange-led businesses at 44%.
- Transaction take rate is the most common primary model, used by 24% of the companies in our dataset.
- Companies that rely on net interest income post a median 47% gross margin, and that figure moves with interest rates because deposit and funding costs sit in cost of revenue.
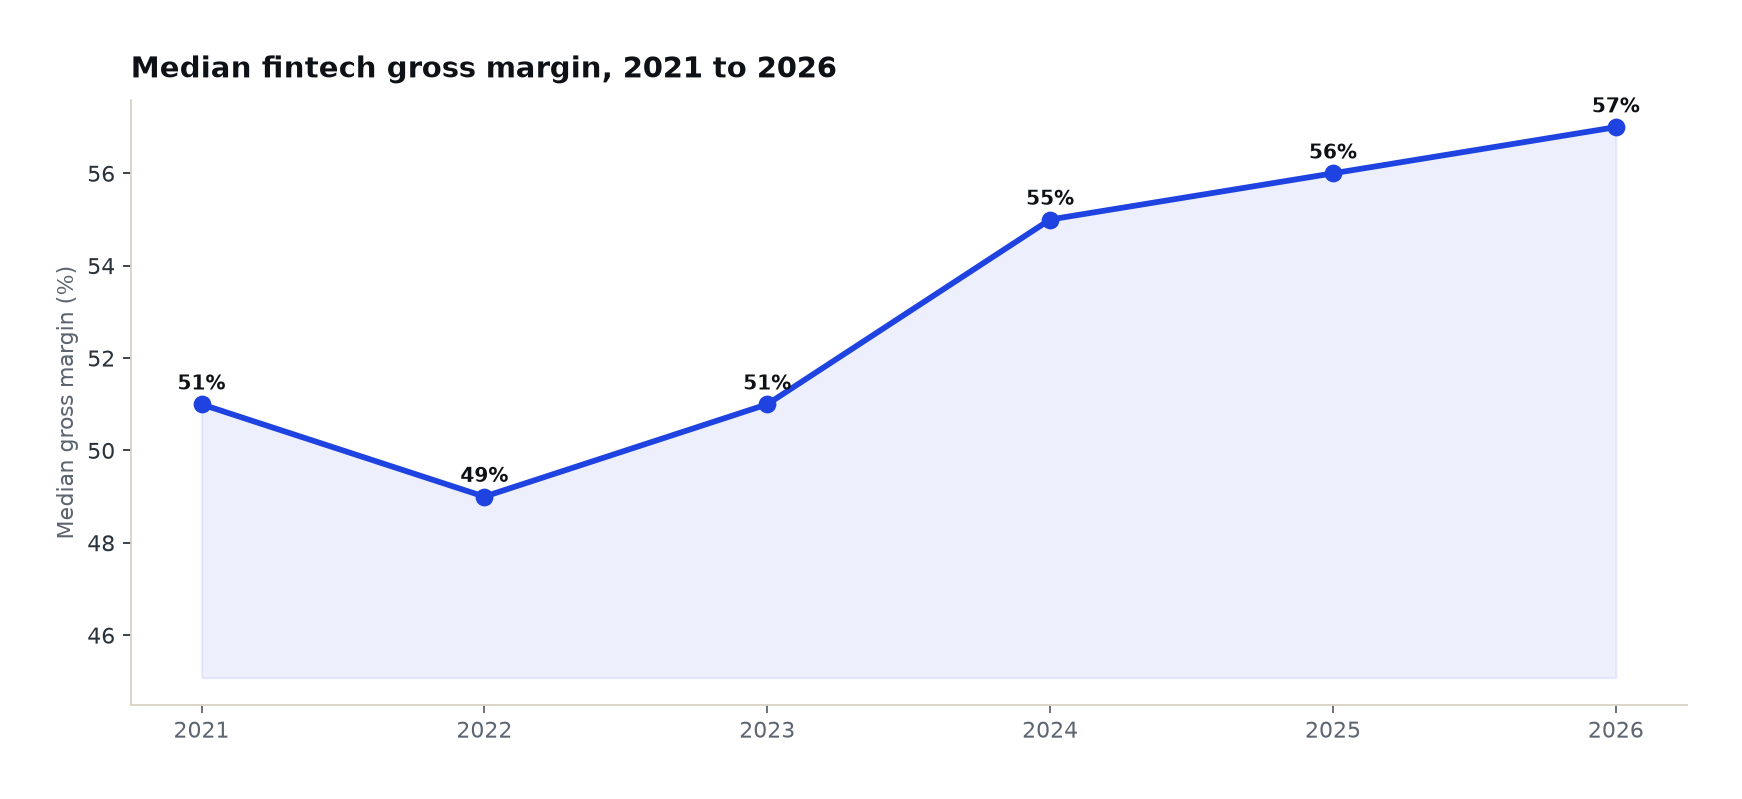
Fintech Gross Margin, 2021 to 2026
The table below tracks the median gross margin across our dataset by year, using companies with financial data for each year.
| Year | Median Gross Margin | Change vs. Prior Year |
|---|---|---|
| 2021 | 51% | Baseline |
| 2022 | 49% | -2 pts |
| 2023 | 51% | +2 pts |
| 2024 | 55% | +4 pts |
| 2025 | 56% | +1 pt |
| 2026 | 57% | +1 pt |
- Median gross margin fell to 49% in 2022, as rising rates increased funding costs and credit losses climbed.
- It has risen every year since, gaining 8 points to 57% in 2026.
- The largest annual gain came in 2024, at 4 points, as companies repriced products and cut unprofitable customer segments.
What Fintech Cost of Revenue Is Made Of
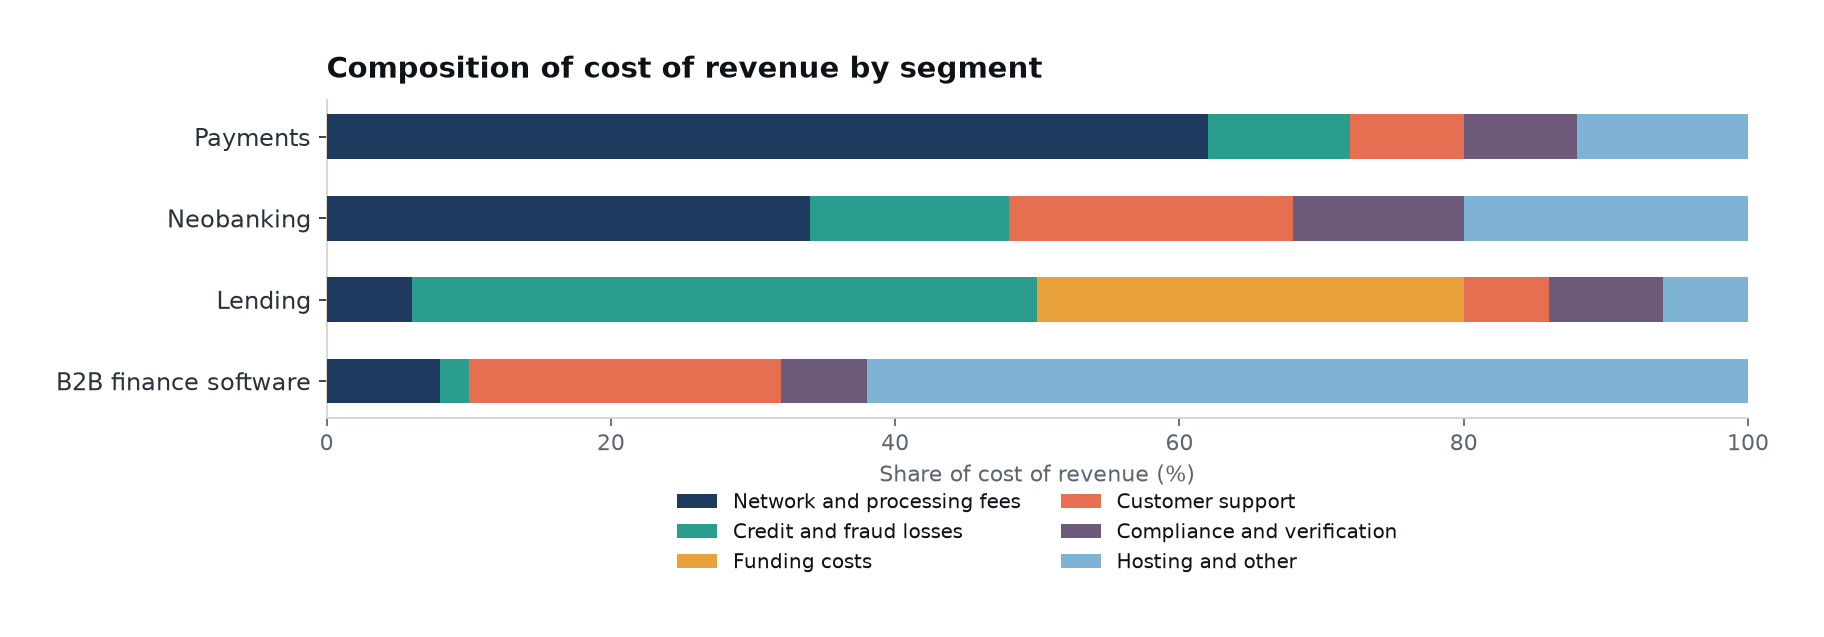
In the table below, we break cost of revenue into six categories for four segments with very different cost structures.
| Cost Category | Payments | Neobanking | Lending | B2B Finance Software |
|---|---|---|---|---|
| Network and processing fees | 62% | 34% | 6% | 8% |
| Credit and fraud losses | 10% | 14% | 44% | 2% |
| Funding costs | 0% | 0% | 30% | 0% |
| Customer support | 8% | 20% | 6% | 22% |
| Compliance and verification | 8% | 12% | 8% | 6% |
| Hosting and other | 12% | 20% | 6% | 62% |
- Network and processing fees make up 62% of cost of revenue at payments companies, so card network pricing changes move their margins more than anything they control internally.
- Credit and fraud losses (44%) and funding costs (30%) together make up 74% of cost of revenue at lenders.
- Customer support makes up 20% of cost of revenue at neobanks, more than twice its share at payments companies or lenders.
Sources
- The Fintech Entrepreneur's Guide to Creating Enterprise Value Starts with Contribution Profit. Bessemer Venture Partners, September 2024.
- A Closer Look at Public Fintech Health and Efficiency. Flagship Advisory Partners, October 2025.
- Fintechs That Raked in Profits from High Interest Rates Now Face Resilience Test. CNBC via NBC4 Washington, May 2025.
- Pulse of Fintech H1 2026. KPMG International, August 2026.