Fintech Compliance Cost Statistics: 2026 Report
What 286 U.S. fintech companies spend on compliance, broken down by company size, segment, spending category, and cost per customer.
This report looks at what 286 U.S. fintech companies spend to comply with financial regulation. The sample ranges from early-stage startups to companies with more than $500 million in annual revenue. Compliance spend in this study includes compliance staff, identity verification and sanctions screening, anti-money laundering (AML) transaction monitoring, outside counsel, licensing and exam fees, and the audits and oversight that partner banks require of their fintech programs. The results below show how that cost scales with company size, which segments carry the heaviest burden, and where the money goes.
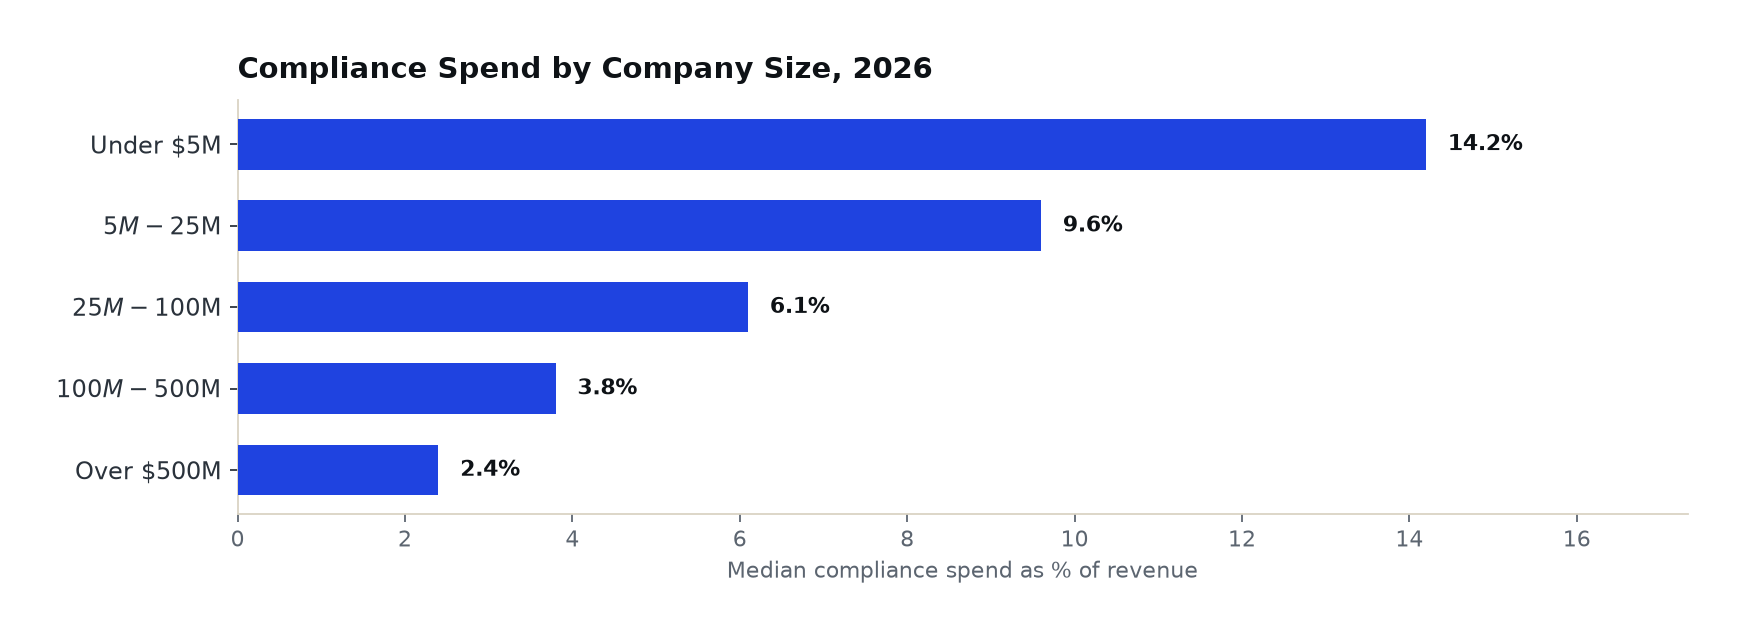
Compliance Spend as a Share of Revenue by Company Size
In the table below, we break down median annual compliance spend by revenue band, both in dollars and as a share of revenue, along with compliance staff as a share of total headcount.
| Annual Revenue | Companies Surveyed | Median Annual Compliance Spend | Compliance Spend as % of Revenue | Compliance Staff as % of Headcount |
|---|---|---|---|---|
| Under $5M | 74 | $0.41M | 14.2% | 9% |
| 5M-25M | 81 | $1.38M | 9.6% | 8% |
| 25M-100M | 63 | $3.60M | 6.1% | 7% |
| 100M-500M | 46 | $9.70M | 3.8% | 6% |
| Over $500M | 22 | $24.5M | 2.4% | 5% |
- Fintechs with less than $5 million in revenue spend a median 14.2% of revenue on compliance, almost six times the 2.4% share at companies above $500 million.
- Dollar spend still rises about 60-fold across the bands, from $0.41 million to $24.5 million a year. Much of a compliance program is a fixed cost that small companies cannot spread across revenue.
- Compliance staff make up 9% of headcount at the smallest companies and 5% at the largest.
Compliance Cost by Fintech Segment
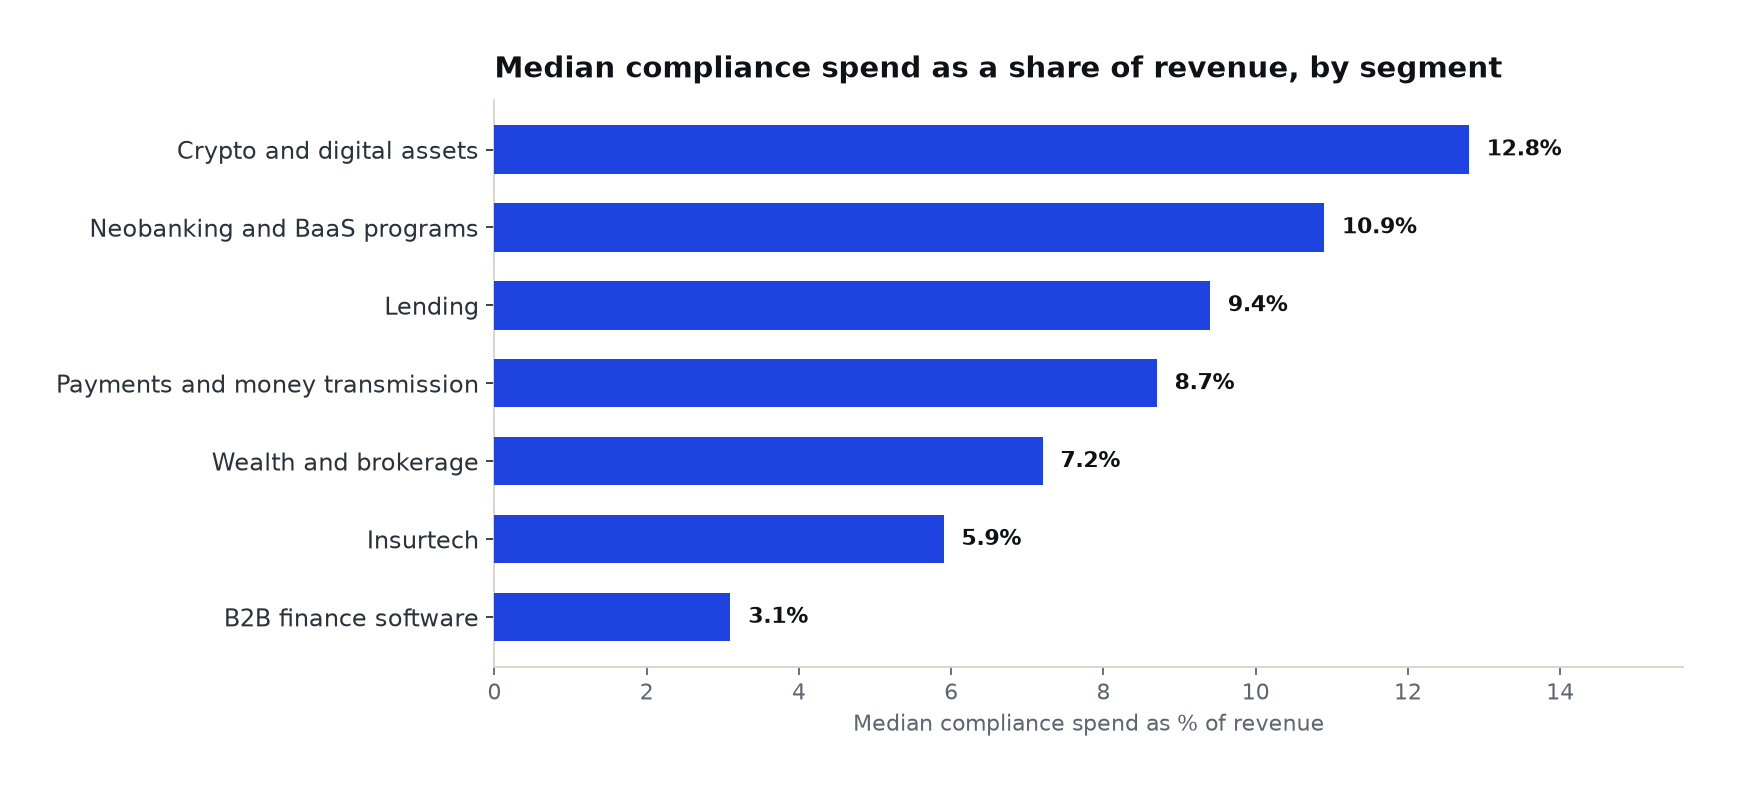
The table below compares median compliance spend as a share of revenue across seven fintech segments, along with the median number of state and federal licenses each segment holds and the share of companies that operated under a regulatory order or a partner bank remediation plan in the past three years.
| Segment | Compliance Spend as % of Revenue | Median Licenses Held | Under an Order or Remediation Plan, Past 3 Years |
|---|---|---|---|
| Crypto and digital assets | 12.8% | 38 | 21% |
| Neobanking and BaaS programs | 10.9% | 4 | 24% |
| Lending | 9.4% | 33 | 14% |
| Payments and money transmission | 8.7% | 41 | 12% |
| Wealth and brokerage | 7.2% | 6 | 8% |
| Insurtech | 5.9% | 27 | 6% |
| B2B finance software | 3.1% | 2 | 2% |
| Segment | Median Compliance Spend as % of Revenue |
|---|---|
| Crypto and digital assets | 12.8% |
| Neobanking and BaaS programs | 10.9% |
| Lending | 9.4% |
| Payments and money transmission | 8.7% |
| Wealth and brokerage | 7.2% |
| Insurtech | 5.9% |
| B2B finance software | 3.1% |
- Crypto and digital asset companies spend the most, 12.8% of revenue, about 4 times the 3.1% spent by B2B finance software companies.
- Neobanks and BaaS programs hold a median of just 4 licenses because they operate under partner banks' charters, yet they spend 10.9% of revenue on compliance and have the highest share of companies (24%) working through an order or remediation plan.
- Payments and money transmission companies hold the most licenses, a median of 41, reflecting state-by-state money transmitter licensing.
Where Compliance Dollars Go
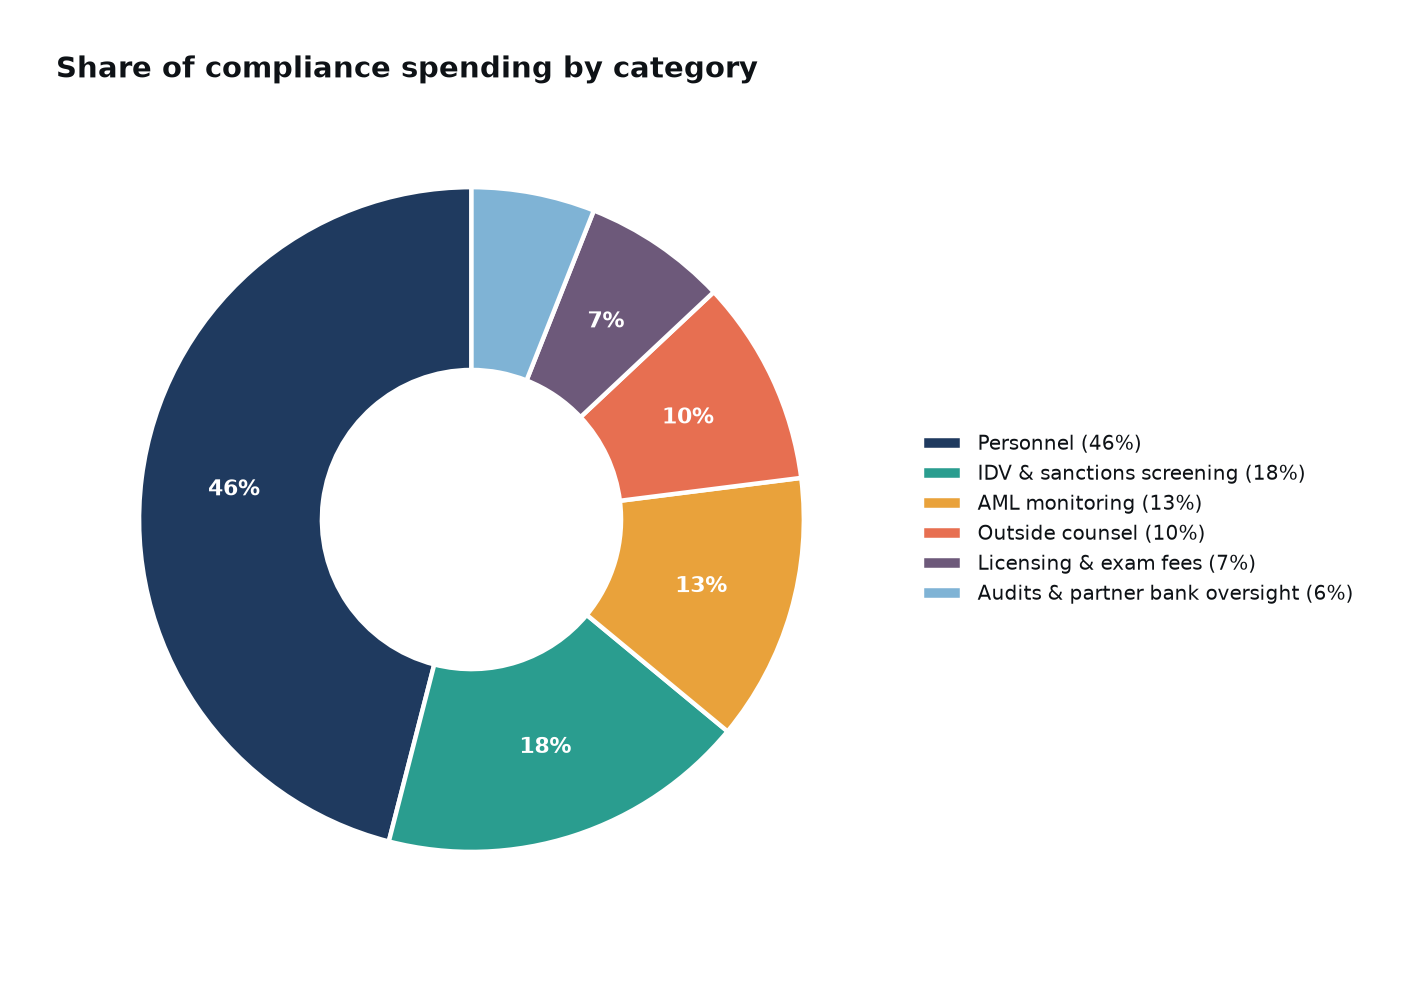
In the table below, we break compliance spending into six categories. The dollar column applies each share to the $1.38 million median for companies with $5 million to $25 million in revenue.
| Spending Category | Share of Compliance Spend | Median Annual Spend, 5M-25M Revenue Companies |
|---|---|---|
| Compliance personnel | 46% | $635K |
| Identity verification and sanctions screening | 18% | $248K |
| AML transaction monitoring software | 13% | $179K |
| Outside counsel | 10% | $138K |
| Licensing and exam fees | 7% | $97K |
| Audits and partner bank oversight | 6% | $83K |
- Compliance personnel account for 46% of spending, the largest single category at every company size we studied.
- Vendor technology for identity verification, screening and transaction monitoring takes a combined 31%.
- Audits and partner bank oversight make up 6% of spend, but as the next section shows, it is the second-fastest-growing category.
Year-over-Year Compliance Cost Growth
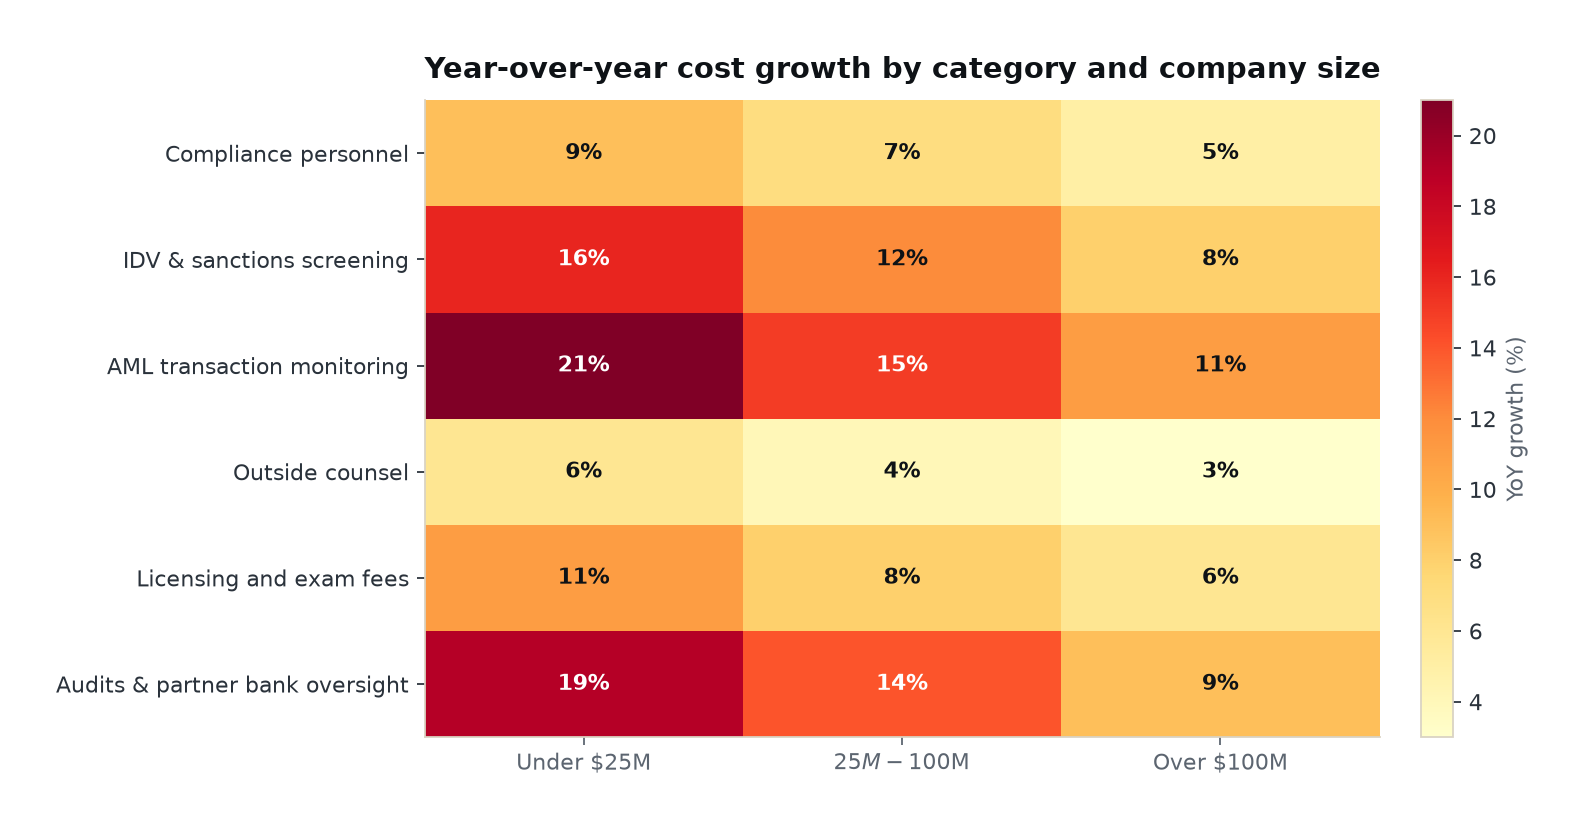
The table below shows the median year-over-year increase in total compliance cost by company size. The heatmap that follows breaks that growth out by spending category.
| Annual Revenue | Median Growth in Total Compliance Cost | Fastest-Growing Category |
|---|---|---|
| Under $25M | 12% | AML transaction monitoring software (21%) |
| 25M-100M | 9% | AML transaction monitoring software (15%) |
| Over $100M | 6% | AML transaction monitoring software (11%) |
| Category | Under $25M | 25M-100M | Over $100M |
|---|---|---|---|
| Compliance personnel | 9% | 7% | 5% |
| Identity verification and sanctions screening | 16% | 12% | 8% |
| AML transaction monitoring software | 21% | 15% | 11% |
| Outside counsel | 6% | 4% | 3% |
| Licensing and exam fees | 11% | 8% | 6% |
| Audits and partner bank oversight | 19% | 14% | 9% |
- Total compliance cost grew a median 12% over the prior year at companies under $25 million in revenue, double the 6% rate at companies above $100 million.
- AML transaction monitoring software is the fastest-growing category in every size band, rising 21% at the smallest companies.
- Audits and partner bank oversight grew 19% at companies under $25 million in revenue, as partner banks expanded testing requirements for their fintech programs.
Compliance Cost Per Customer by Business Model
Revenue ratios hide how compliance cost scales with the customer base. The table below shows median annual compliance cost per customer for six business models, measured against each model's natural customer unit.
| Business Model | Customer Unit | Median Annual Compliance Cost Per Customer |
|---|---|---|
| Consumer neobank | Per active account | $11.40 |
| Brokerage and investing app | Per funded account | $14.80 |
| Crypto exchange | Per verified user | $17.60 |
| Consumer lender | Per funded loan | $38.00 |
| Payment facilitator | Per active merchant | $96.00 |
| B2B finance software | Per business customer | $420.00 |
- Consumer neobanks spend a median $11.40 per active account each year on compliance, the lowest per-customer figure in the study.
- Crypto exchanges spend $17.60 per verified user, 54% more than neobanks, driven by blockchain analytics and enhanced due diligence on higher-risk users.
- B2B finance software carries the highest per-customer cost at $420 per business customer, since every business customer requires beneficial ownership checks.
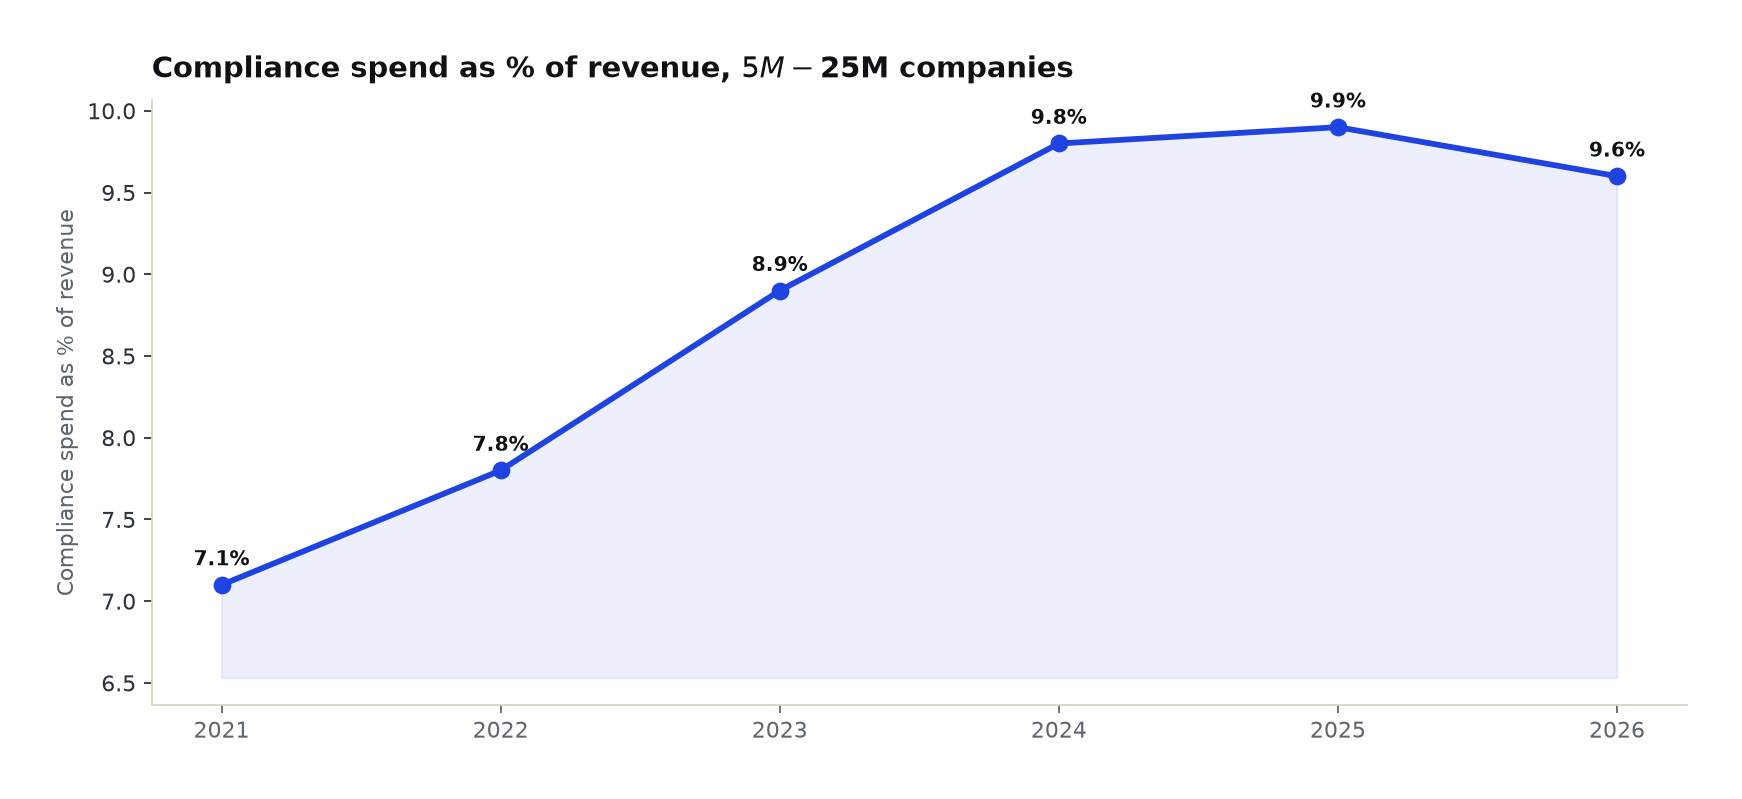
Compliance Spend as a Share of Revenue, 2021 to 2026
The table below tracks median compliance spend as a share of revenue for companies with $5 million to $25 million in annual revenue, the band with the most consistent year-over-year sample in our dataset.
| Year | Median Compliance Spend as % of Revenue | Change vs. Prior Year |
|---|---|---|
| 2021 | 7.1% | Baseline |
| 2022 | 7.8% | +0.7 pts |
| 2023 | 8.9% | +1.1 pts |
| 2024 | 9.8% | +0.9 pts |
| 2025 | 9.9% | +0.1 pts |
| 2026 | 9.6% | -0.3 pts |
- Compliance spend rose from 7.1% of revenue in 2021 to a peak of 9.9% in 2025, an increase of 2.8 percentage points.
- The sharpest increase came in 2023, when the share rose 1.1 points as enforcement against partner banks spread to their fintech programs.
- 2026 is the first year in the series in which the ratio fell, to 9.6%, as automation of screening and case review began to offset headcount growth.
Sources
- True Cost of Financial Crime Compliance 2024. LexisNexis Risk Solutions, 2024.
- BaaS is Not in Crisis: BaaS Banks Less Likely to Be Fined Than Non-BaaS Banks. Castellum.AI, 2024.
- Recent FDIC Consent Orders Show Increased Regulatory Scrutiny of Bank Relationships with Fintech Partners. Consumer Finance Monitor, Ballard Spahr, April 2024.
- Banking-as-a-Service Players at Crossroads, Weighing Growth, Compliance Costs. S&P Global Market Intelligence, April 2024.