Debit Interchange Fee Statistics: 2026 Report
How much does a store pay a bank every time you pay with a debit card? We worked it out from the fee data banks and card networks report to the Federal Reserve.

When you pay with a debit card, the store pays a fee to the bank that issued your card. Federal rules cap that fee, but only for cards from big banks, those with $10 billion or more in assets. The fees on cards from smaller banks aren't capped, and they've been rising.
Our analysts studied the Federal Reserve's data under Regulation II, the rule that sets the cap, for every US debit and general-use prepaid card network, covering 2009 through 2024, and collected it on October 13, 2026. We compared what card-issuing banks earn from these fees, how capped banks compare with exempt ones, and how the cap compares with the banks' own processing costs.
In the following sections, we track fee revenue by year, compare the average fee at covered and exempt banks, break fees down by network, and set the cap against issuer costs.
Debit Interchange Fee Revenue by Year
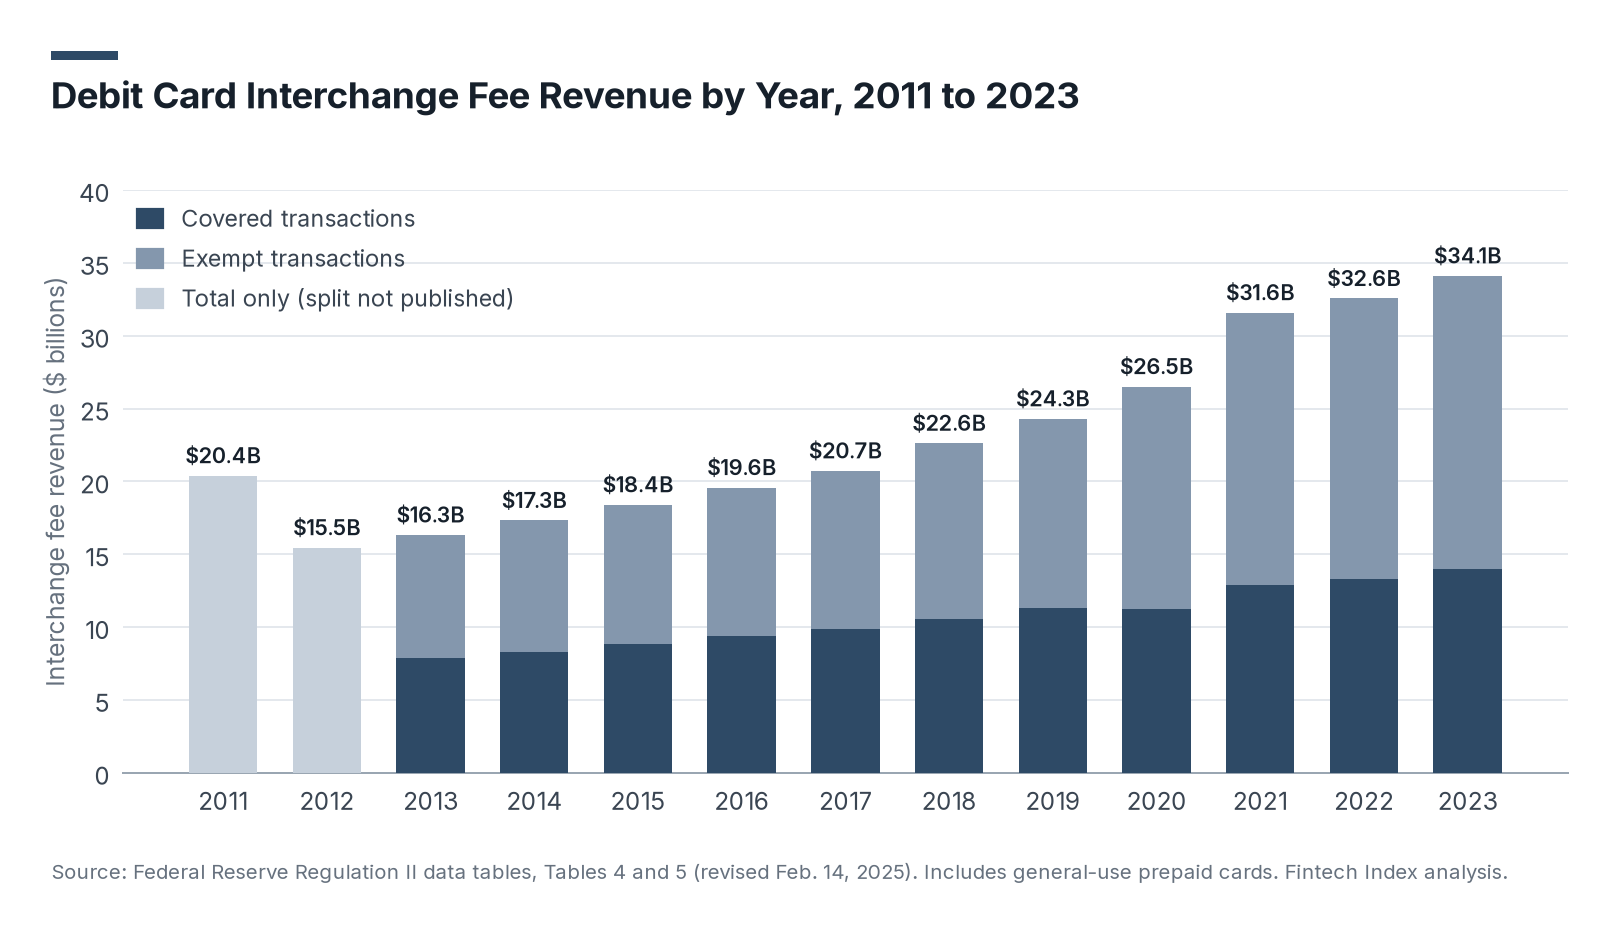
An interchange fee is the amount a merchant's bank pays the cardholder's bank on each debit card purchase. Total interchange revenue shows how much merchants pay card-issuing banks for debit acceptance each year. The yearly totals come from the Federal Reserve's Regulation II data tables and include general-use prepaid cards.
| Year | Total Interchange Revenue | Covered Transaction Revenue | Exempt Transaction Revenue | Average Fee per Transaction, All |
|---|---|---|---|---|
| 2011 | $20.40B | Not published | Not published | $0.437 |
| 2012 | $15.46B | Not published | Not published | $0.307 |
| 2013 | $16.33B | $7.87B | $8.46B | $0.304 |
| 2015 | $18.41B | $8.82B | $9.59B | $0.304 |
| 2017 | $20.73B | $9.88B | $10.85B | $0.303 |
| 2019 | $24.31B | $11.30B | $13.00B | $0.307 |
| 2020 | $26.52B | $11.27B | $15.25B | $0.327 |
| 2021 | $31.59B | $12.93B | $18.67B | $0.343 |
| 2022 | $32.56B | $13.28B | $19.28B | $0.343 |
| 2023 | $34.12B | $14.02B | $20.10B | $0.339 |
- Interchange revenue more than doubled from $15.46 billion in 2012, the first full year under the cap, to $34.12 billion in 2023, an increase of 2.21 times.
- Debit acceptance keeps costing merchants more even though the cap holds covered fees steady. Interchange revenue grew 40.4% from 2019 to 2023, to $34.12 billion.
- Exempt-transaction revenue rose 137.4% from 2013 to 2023, while covered-transaction revenue rose 78.2%.
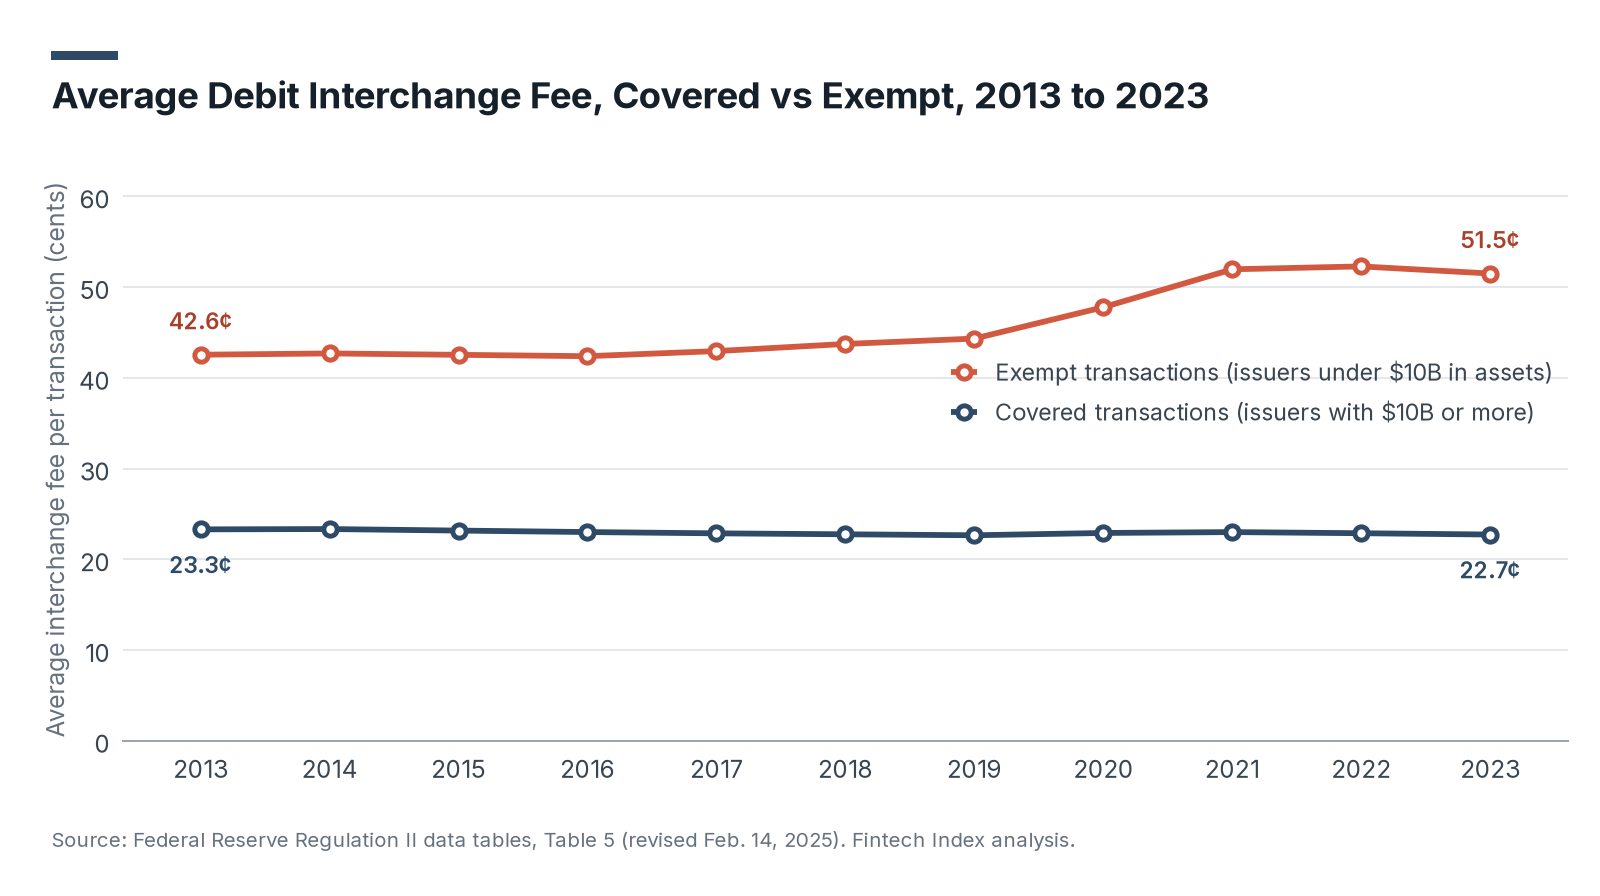
Average Debit Interchange Fee per Transaction: Covered vs Exempt
Regulation II splits the debit market in two. Issuers with $10 billion or more in assets are held to the cap, while issuers under $10 billion in assets, along with some government benefit and prepaid cards, are exempt.
| Year | Covered Transactions | Exempt Transactions | Exempt Fee as a Multiple of Covered | Covered Share of Transactions |
|---|---|---|---|---|
| 2013 | $0.233 | $0.426 | 1.83x | 62.9% |
| 2015 | $0.232 | $0.425 | 1.84x | 62.8% |
| 2017 | $0.229 | $0.430 | 1.88x | 63.1% |
| 2019 | $0.227 | $0.443 | 1.96x | 63.0% |
| 2020 | $0.229 | $0.478 | 2.09x | 60.7% |
| 2021 | $0.230 | $0.520 | 2.26x | 61.0% |
| 2022 | $0.229 | $0.523 | 2.29x | 61.2% |
| 2023 | $0.227 | $0.515 | 2.27x | 61.2% |
- The average fee on covered transactions was 22.7 cents in 2023, down 2.4% from 23.3 cents in 2013.
- The average fee on exempt transactions was 51.5 cents in 2023, up 21.0% from 42.6 cents in 2013. Most of the increase came from 2019 to 2021.
- In 2023, an exempt transaction carried 2.27 times the interchange of a covered one.
- Exempt issuers collected 58.9% of the $34.12 billion in 2023 interchange revenue while handling 38.8% of transactions.
- A merchant pays more than twice as much when a customer uses a card from a small, exempt issuer. The Fed's 2024 data shows $0.23 on covered transactions and $0.51 on exempt ones.
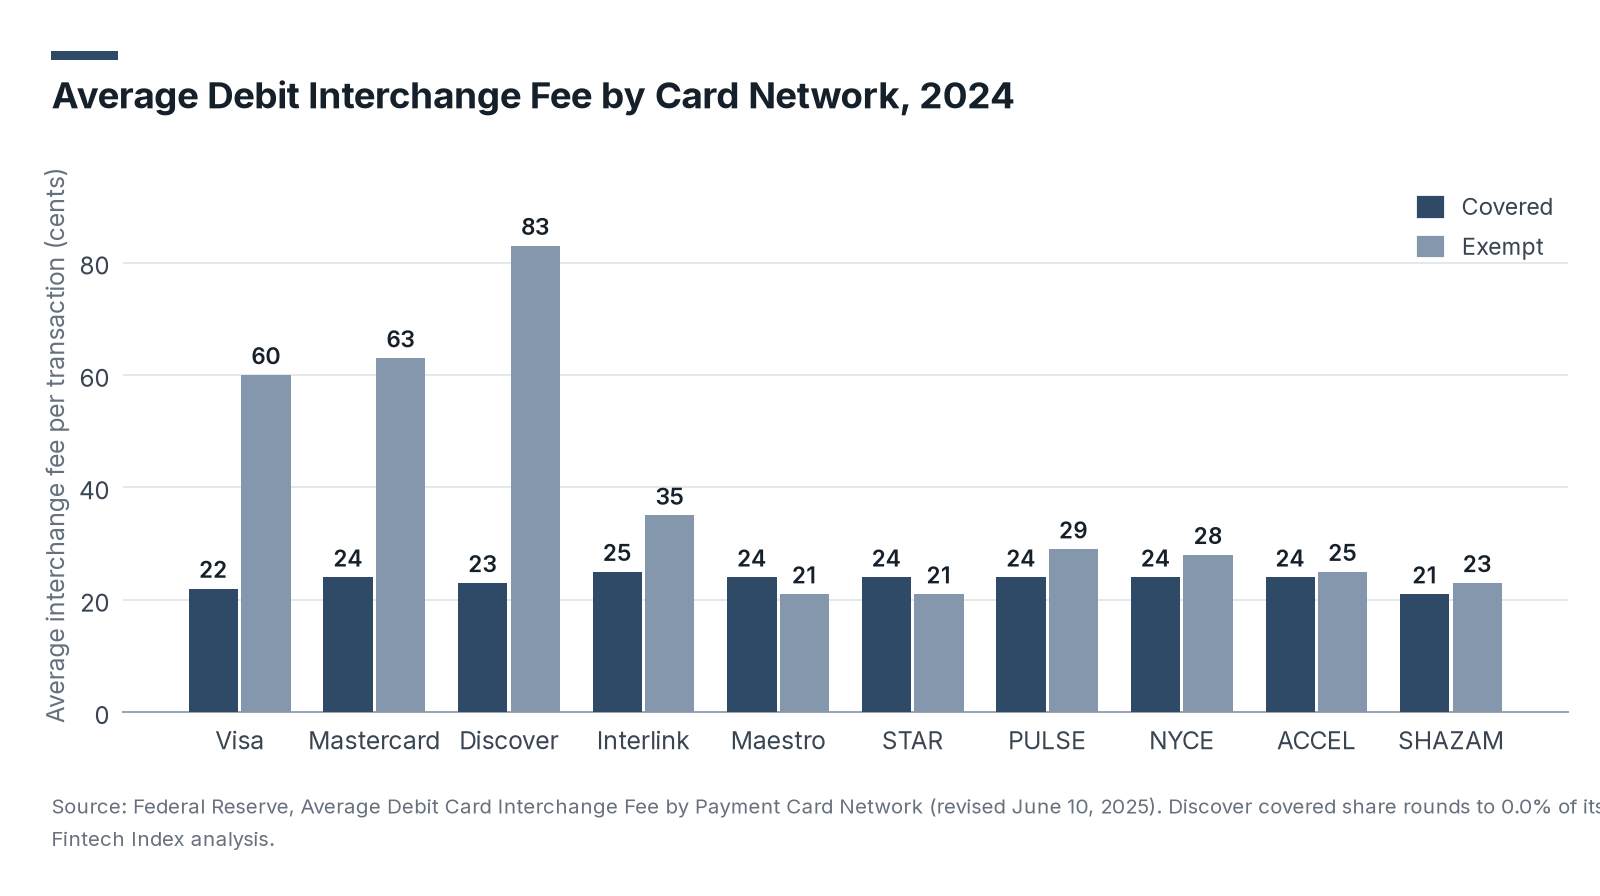
Debit Interchange Fees by Card Network
Each network sets its own interchange schedule, and the gap between covered and exempt fees varies widely from one network to the next. The figures below are the Federal Reserve's 2024 averages, published in cents.
| Network | Covered Transactions | Exempt Transactions | All Transactions | Covered Share of Network Transactions |
|---|---|---|---|---|
| Visa | $0.22 | $0.60 | $0.36 | 63.9% |
| Mastercard | $0.24 | $0.63 | $0.43 | 51.9% |
| Discover | $0.23 | $0.83 | $0.83 | 0.0% |
| Interlink | $0.25 | $0.35 | $0.27 | 76.1% |
| Maestro | $0.24 | $0.21 | $0.23 | 74.9% |
| STAR | $0.24 | $0.21 | $0.23 | 52.7% |
| PULSE | $0.24 | $0.29 | $0.27 | 44.2% |
| NYCE | $0.24 | $0.28 | $0.27 | 27.8% |
| ACCEL | $0.24 | $0.25 | $0.25 | 25.1% |
| SHAZAM | $0.21 | $0.23 | $0.23 | 8.9% |
| All networks | $0.23 | $0.51 | $0.34 | 60.7% |
- The network that carries a transaction changes what a merchant pays. Single-message (PIN) networks charged 26 cents on average on exempt transactions, against 61 cents for dual-message (signature) networks.
- Exempt fees range from 21 cents on Maestro and STAR to 83 cents on Discover. Visa averaged 60 cents and Mastercard 63 cents on exempt transactions.
Regulation II Cap vs Issuer Costs
The cap is meant to let large banks recover their cost of processing a debit transaction. Comparing the cap with the costs banks report shows how much room it leaves.
- The current cap is 21 cents plus 0.05% of the purchase amount, plus 1 cent for issuers that meet the Federal Reserve's fraud-prevention standards. On a $50 purchase, that comes to 24.5 cents.
- Covered issuers reported average authorization, clearing and settlement costs, excluding fraud losses, of 4.09 cents per transaction in 2023, down from 7.71 cents in 2009.
- In October 2023, the Federal Reserve proposed lowering the base component to 14.4 cents, the ad valorem component to 0.04% and the fraud-prevention adjustment to 1.3 cents. As of October 13, 2026, no final rule has been published in the Federal Register. In August 2025, a federal court in North Dakota vacated Regulation II's fee cap but stayed its ruling during the appeal, so the cap remains in force; the Eighth Circuit heard the Federal Reserve's appeal in May 2026, and a related appeal in the Sixth Circuit is set for argument on October 22, 2026.
| Year | Average ACS Cost, All Covered Issuers |
|---|---|
| 2009 | $0.0771 |
| 2011 | $0.0506 |
| 2013 | $0.0462 |
| 2015 | $0.0420 |
| 2017 | $0.0356 |
| 2019 | $0.0389 |
| 2021 | $0.0388 |
| 2023 | $0.0409 |
- The cap leaves large banks a wide margin over the processing costs the Federal Reserve measures. Its 21-cent base alone is more than five times the 4.09 cents covered issuers reported in 2023.
What Debit Interchange Fee Trends Mean for 2027 and Beyond
The fee a store pays on a debit purchase is set mainly by two things: the size of the bank that issued the card, and the network that carries the payment. As more spending moves to debit, that cost grows, and most of the growth now goes to banks that face no limit. Stores pay it, and over time some of that cost shows up in the prices everyone pays.
That could change soon. A court has already thrown out the cap, and the Federal Reserve's own proposal would lower it, so the next year or two will decide whether these fees get cheaper, stay where they are, or lose their limit altogether. Each outcome changes how much stores pay and how much banks earn on every purchase.
So if you take debit cards at your business, keep an eye on the appeals and ask your payment provider how your debit sales are routed, because the network you use already makes a real difference to what you pay.
Data Collection and Methodology
Every figure comes from data banks and networks report to the Federal Reserve under Regulation II, and the definitions below match the Board's own.
We downloaded the Board's Regulation II data tables (revised February 14, 2025), which run through calendar year 2023, and its table of average debit card interchange fees by payment card network (revised June 10, 2025), which runs through 2024. Revenue and per-transaction figures for 2011 to 2023 come from Tables 4 and 5, and processing costs from Table 13. The covered share of transactions was computed by dividing each year's covered and exempt revenue by its average fee per transaction to recover transaction counts. The multiple of exempt to covered fees and all growth rates were computed from the Board's unrounded values. The 2024 network averages are published rounded to the cent and are shown as published.
Covered transactions are those processed by issuers with $10 billion or more in assets that do not qualify for another exemption. Exempt transactions include those of smaller issuers and certain government-program and reloadable prepaid cards issued by covered issuers. The Board's per-transaction fee is total interchange fees divided by the number of settled purchase transactions. ACS costs are the Board's measure of authorization, clearing and settlement costs, excluding fraud losses, and are collected every two years. Interchange is one part of what a merchant pays to accept a debit card, which also includes network fees and the acquirer's markup. Pre-2013 totals do not split covered and exempt revenue. The Board's tables also give figures for 2014, 2016 and 2018, which are left out of the tables above.
Sources
- Fintech Index, Debit Interchange Fee Study: analysis of Federal Reserve Regulation II data on interchange fee revenue, per-transaction fees by issuer status and card network, and covered issuer costs, 2009 to 2024, conducted October 2026.
- Federal Reserve Board, Regulation II Reports and Data Collections
- Federal Reserve Board, Regulation II data tables (revised Feb. 14, 2025)
- Federal Reserve Board, Average Debit Card Interchange Fee by Payment Card Network
- Federal Reserve Board, 2023 Interchange Fee Revenue, Covered Issuer Costs, and Covered Issuer and Merchant Fraud Losses Related to Debit Card Transactions
- Federal Reserve Board, Regulation II Interchange Fee Standards
- Federal Reserve Board, press release on proposal to lower the debit card interchange fee cap, Oct. 25, 2023
- eCFR, 12 CFR Part 235 (Regulation II)
- Reuters, US judge vacates Fed's debit card 'swipe fees' rule, but pauses order for appeal, Aug. 7, 2025
- America's Credit Unions, Fed interchange rule challenge heard by appeals court, May 15, 2026
- U.S. Court of Appeals for the Sixth Circuit, Oral Argument Calendar, week of October 19 to 23, 2026