Cross-Border Payment Fees Statistics: 2026 Report

Our analysts reviewed 17 published card and currency conversion fees from 10 companies rated on The Fintech Index, along with World Bank remittance prices, Financial Stability Board cost indicators, and the latest Visa and Mastercard results, covering 2023 through 2026, to understand what cross-border payment fees look like as of Q4 2026.
Key Findings
- Card foreign transaction fees across nine plans at six rated business and spending accounts range from 0% to 3%, with a median of 1.75%.
- Published currency conversion fees at six rated brokers and business accounts range from 0.002% at Interactive Brokers to 1% at Rho.
- The average cost of a person-to-person cross-border payment was 2.6% in 2025, and business-to-business payments averaged 1.6%, against a G20 target of 1% by the end of 2027.
- Sending a $200 remittance cost an average of 6.5% in Q1 2025, more than twice the G20 target of 3% for 2030.
- Visa's cross-border volume excluding intra-Europe grew 12% in fiscal 2026, faster than its 9% growth in total payments volume.
A cross-border payment is any payment where the sender and the receiver are in different countries, such as a UK business paying a supplier in Germany or a worker in the United States sending money home. The price usually comes in two parts: a stated fee, and a markup on the exchange rate that the customer rarely sees as a separate line. Fintech companies have competed hard on both, and several now publish their markups as a single percentage. But the averages for the market as a whole have barely moved.
We collected the published card foreign transaction fees and currency conversion fees of 10 rated companies from their own pricing pages in October 2026. We compared them with the cost indicators the Financial Stability Board publishes for the G20, the World Bank's Remittance Prices Worldwide averages, and the cross-border volume growth Visa and Mastercard reported for 2026.
In the following sections, we compare card foreign transaction fees, currency conversion fees, retail cross-border payment costs by use case, remittance costs, and cross-border card volume growth.
Card Foreign Transaction Fees Run From 0% To 3% At Rated Accounts
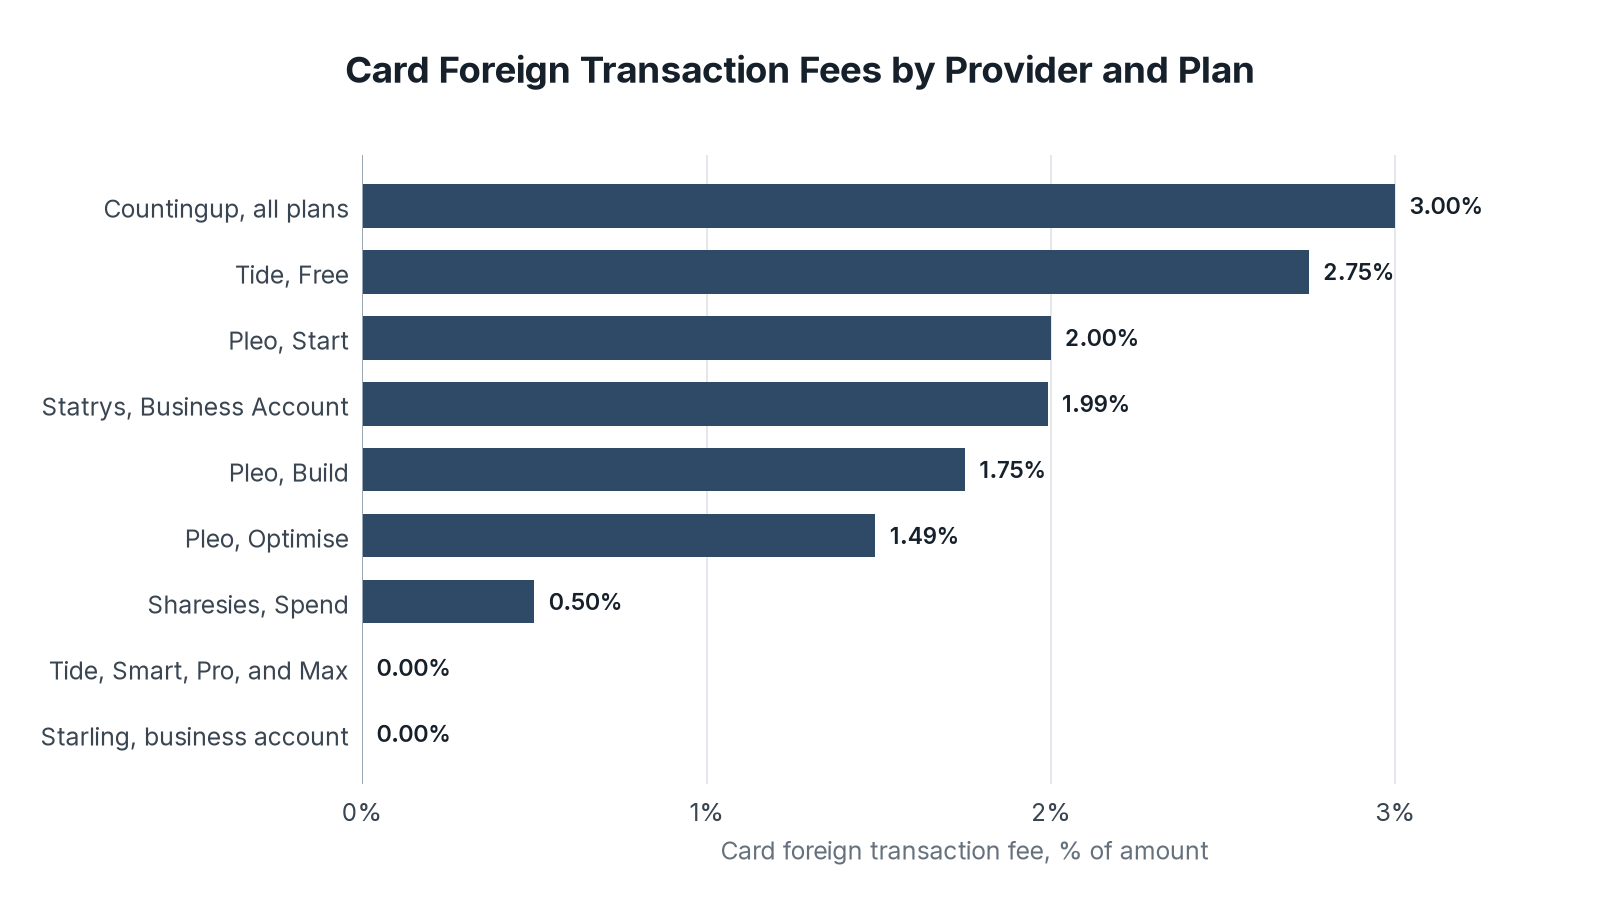
A card foreign transaction fee is the percentage a provider adds when a cardholder pays in another currency, such as a team member buying software priced in dollars on a card funded in pounds. We gathered the published fee for each plan at the rated business and spending accounts that state one.
| Company | Plan or account | Card foreign transaction fee | Fintech Index rating |
|---|---|---|---|
| Countingup | All plans | 3.00% | 74 |
| Tide | Free | 2.75% | 80 |
| Pleo | Start | 2.00% | 79 |
| Statrys | Business Account (Hong Kong) | 1.99% | 75 |
| Pleo | Build | 1.75% | 79 |
| Pleo | Optimise | 1.49% | 79 |
| Sharesies | Spend | 0.50% | 75 |
| Tide | Smart, Pro, and Max | 0.00% | 80 |
| Starling | Business account | 0.00% | 82 |
Key Findings
- On $10,000 of card spending in other currencies, a 3% fee costs $300, a 1.75% fee costs $175, and a 0% fee costs nothing. The gap is large enough that a business with regular overseas card spending should check this line before the monthly plan price.
- Tide and Pleo both cut the fee as customers move to paid plans. Tide drops it from 2.75% on its free plan to 0% on Smart, Pro, and Max, and Pleo lowers it from 2.00% on Start to 1.49% on Optimise.
- Pleo applies the same percentage to invoice payments in another currency, and it charges about $10.70 per international payment on Start and about $8.03 on Build and Optimise.
Currency Conversion Markups Range From 0.002% To 1%
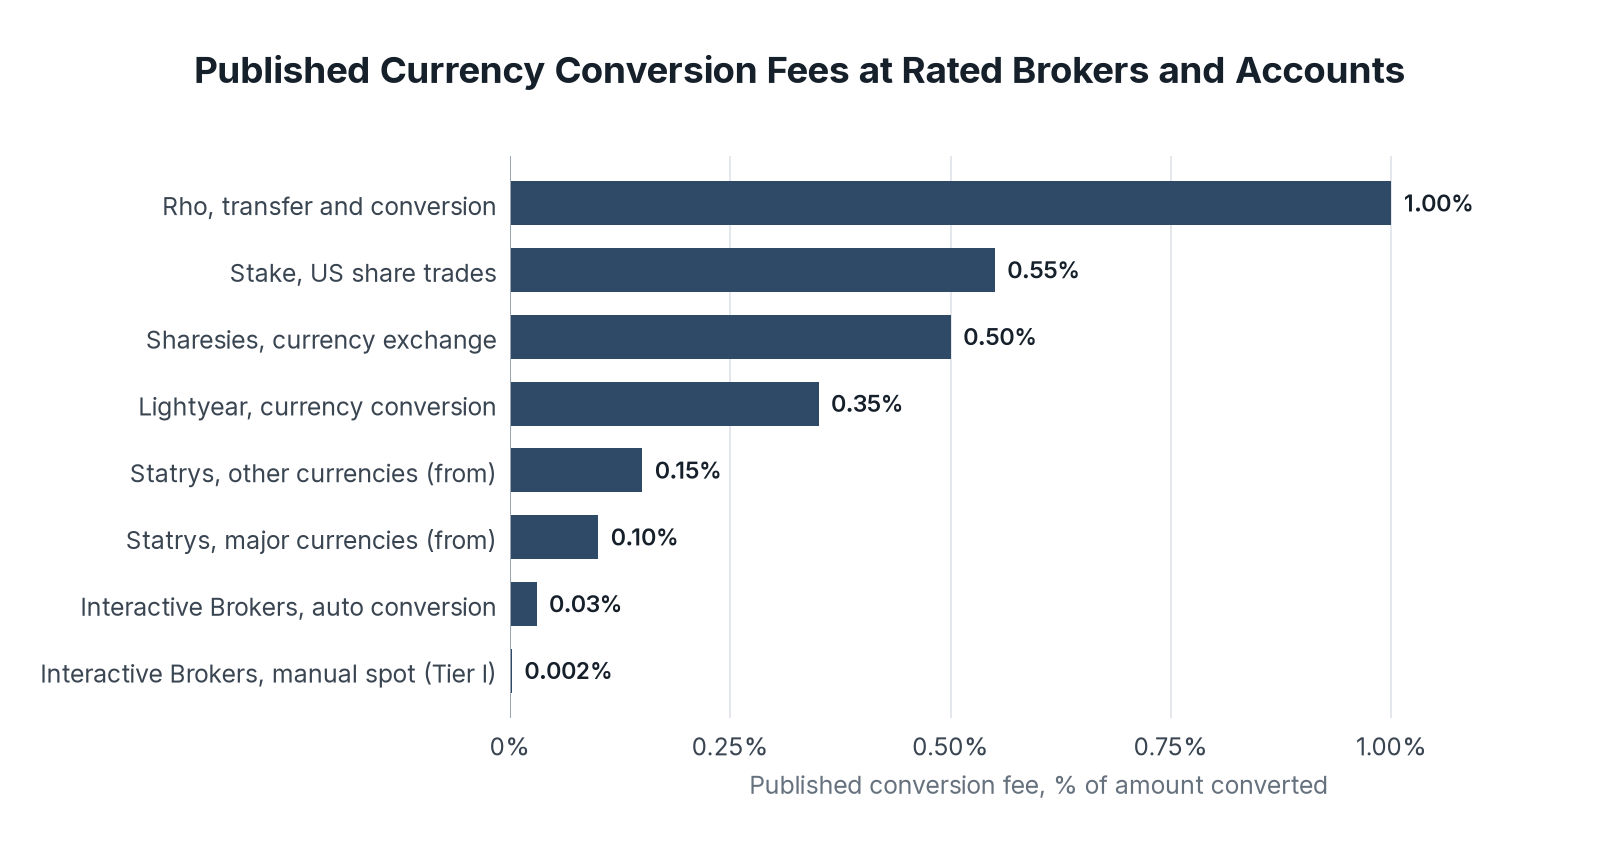
Brokers and business accounts also charge when customers convert money from one currency to another, for example to buy US shares from an Australian account or to pay a foreign supplier. We gathered the conversion fee each rated company publishes, along with any minimum charge per conversion.
| Company | Service | Published conversion fee | Minimum per conversion | Fintech Index rating |
|---|---|---|---|---|
| Rho | Foreign currency transfer and conversion | 1.00% | None published | 80 |
| Stake | US share trades (Australian accounts) | 0.55% | US$2 | 78 |
| Sharesies | Currency exchange | 0.50% | None published | 75 |
| Lightyear | Currency conversion | 0.35% | None published | 80 |
| Statrys | FX, other currencies | From 0.15% | None published | 75 |
| Statrys | FX, major currencies | From 0.10% | None published | 75 |
| Interactive Brokers | Auto currency conversion | 0.03% | None published | 83 |
| Interactive Brokers | Manual spot conversion (Tier I) | 0.002% | $2.00 | 83 |
Key Findings
- Converting $5,000 costs $50 at a 1% fee, $27.50 at 0.55%, and $17.50 at 0.35%. At Interactive Brokers' manual rate, the same conversion costs the $2.00 minimum, since 0.002% of $5,000 is 10 cents.
- Stake charges its 0.55% each way, so an Australian investor who buys US shares and later brings the money home pays the fee twice. On a $1,000 purchase that is later sold and converted back, the two conversions cost about $11.
- Rho's 1% fee on foreign currency transfers matches the G20's 1% cost target for retail payments, and every other conversion fee in this group comes in under it.
Retail Cross-Border Payments Cost 1.6% To 2.6%, Mostly In FX
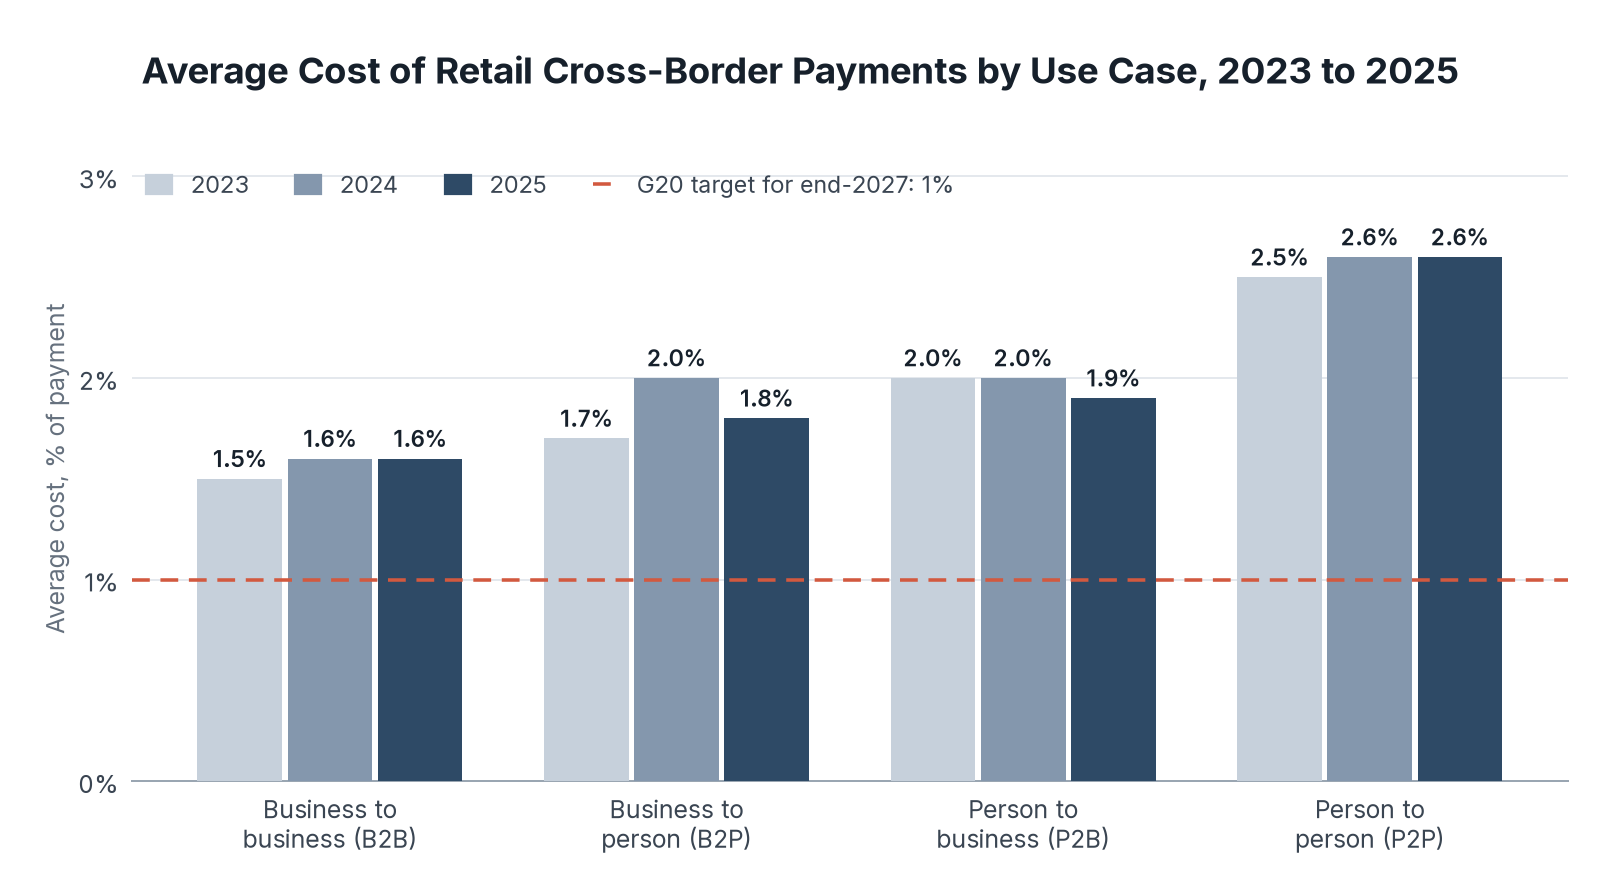
The Financial Stability Board tracks the average cost of retail cross-border payments for the G20 using price data from FXC Intelligence. We gathered its cost indicators for four kinds of payment from 2023 to 2025, along with how much of each cost comes from the exchange rate.
| Use case | 2023 average cost | 2024 average cost | 2025 average cost | FX share of 2025 cost | Corridors costing more than 3% (2025) |
|---|---|---|---|---|---|
| Business to business (B2B) | 1.5% | 1.6% | 1.6% | 87.1% | 10% |
| Business to person (B2P) | 1.7% | 2.0% | 1.8% | 74.5% | 12% |
| Person to business (P2B) | 2.0% | 2.0% | 1.9% | 99.7% | 16% |
| Person to person (P2P) | 2.5% | 2.6% | 2.6% | 55.2% | 30% |
Key Findings
- The exchange rate makes up 87.1% of the average cost of a business-to-business payment and 99.7% of a person-to-business payment. A provider with a low or zero stated fee can still be expensive once the rate is counted.
- Person-to-person payments cost the most at 2.6%, and 30% of person-to-person corridors cost more than 3%, the G20's ceiling for any corridor.
- The share of all corridors costing more than 3% fell from 24.1% in 2024 to 18.3% in 2025. The FSB still judged that the 2027 targets are unlikely to be met globally.
Sending $200 Abroad Still Costs About 6.5%
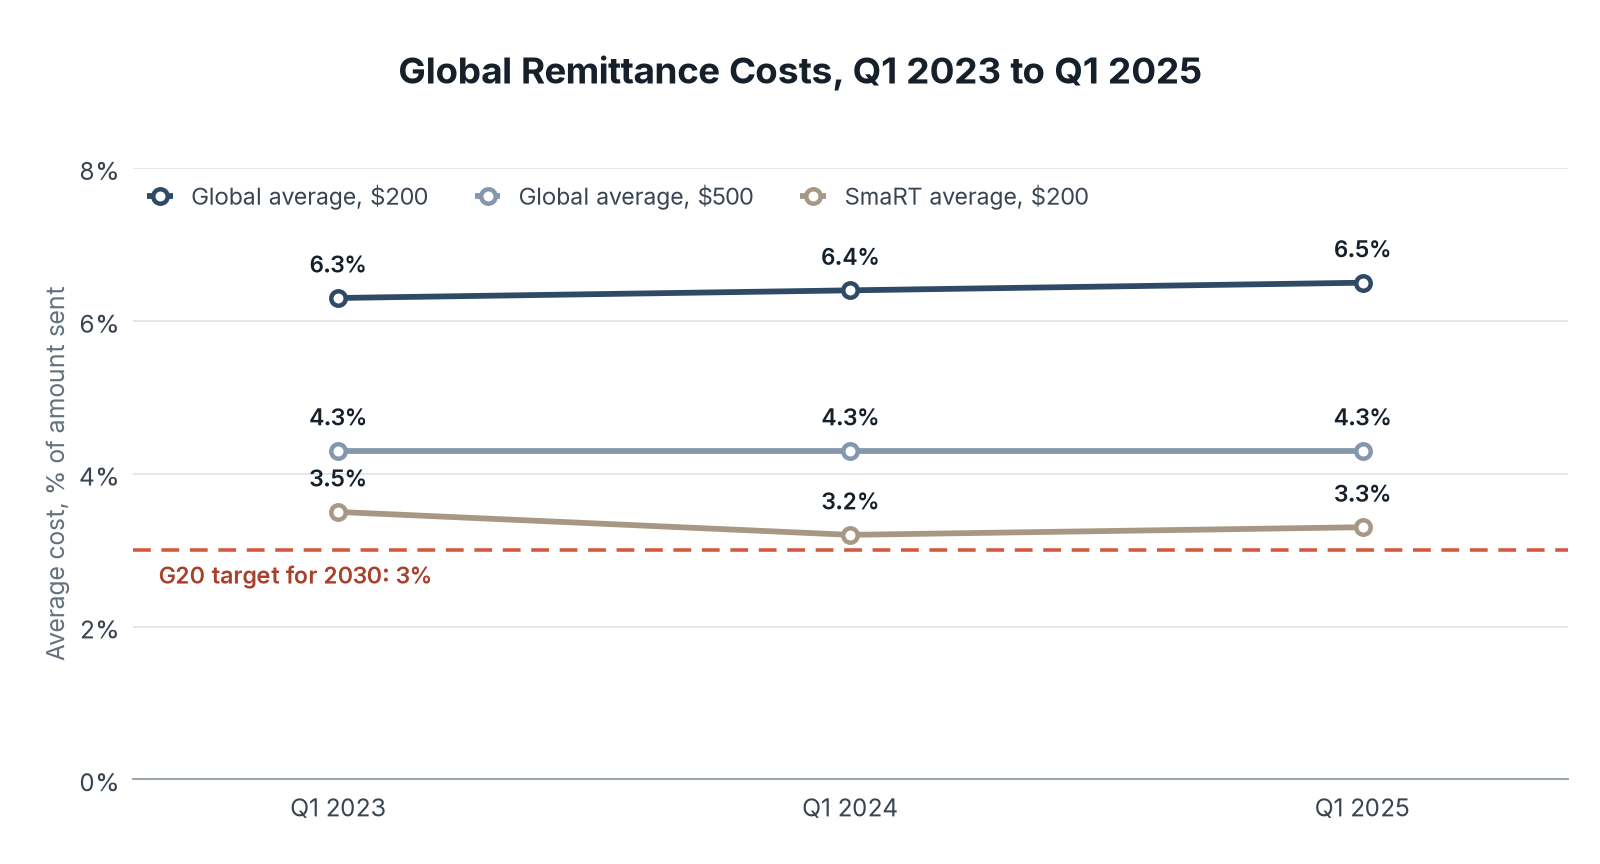
Remittances, the money workers send to family in another country, are usually small and carry the highest percentage costs. We gathered the World Bank's global averages for $200 and $500 transfers and its SmaRT average, the average of the three cheapest services in each corridor, which stands for what an informed sender can find.
| Measure | Q1 2023 | Q1 2024 | Q1 2025 | G20 target |
|---|---|---|---|---|
| Global average cost of sending $200 | 6.3% | 6.4% | 6.5% | 3% by 2030 |
| Global average cost of sending $500 | 4.3% | 4.3% | 4.3% | No separate target |
| SmaRT average cost of sending $200 | 3.5% | 3.2% | 3.3% | No separate target |
| SmaRT average cost of sending $500 | 2.5% | 2.4% | 2.2% | No separate target |
| Corridors with a $200 SmaRT average over 5% | 20.0% | 17.0% | 19.3% | No corridor over 5% |
Key Findings
- A $200 transfer at the 6.5% global average costs $13, and the same transfer at the 3.3% SmaRT average costs about $6.60. Shopping across the three cheapest services in a corridor roughly halves the cost.
- The World Bank's most recent global average, 6.36% in its September 2025 report, is the latest published figure and remains more than double the 3% goal for 2030.
- Larger transfers cost less as a share of the amount: $500 averaged 4.3% in each of the three years, while $200 rose from 6.3% to 6.5%.
Card Network Cross-Border Volume Is Growing Faster Than Overall Card Volume
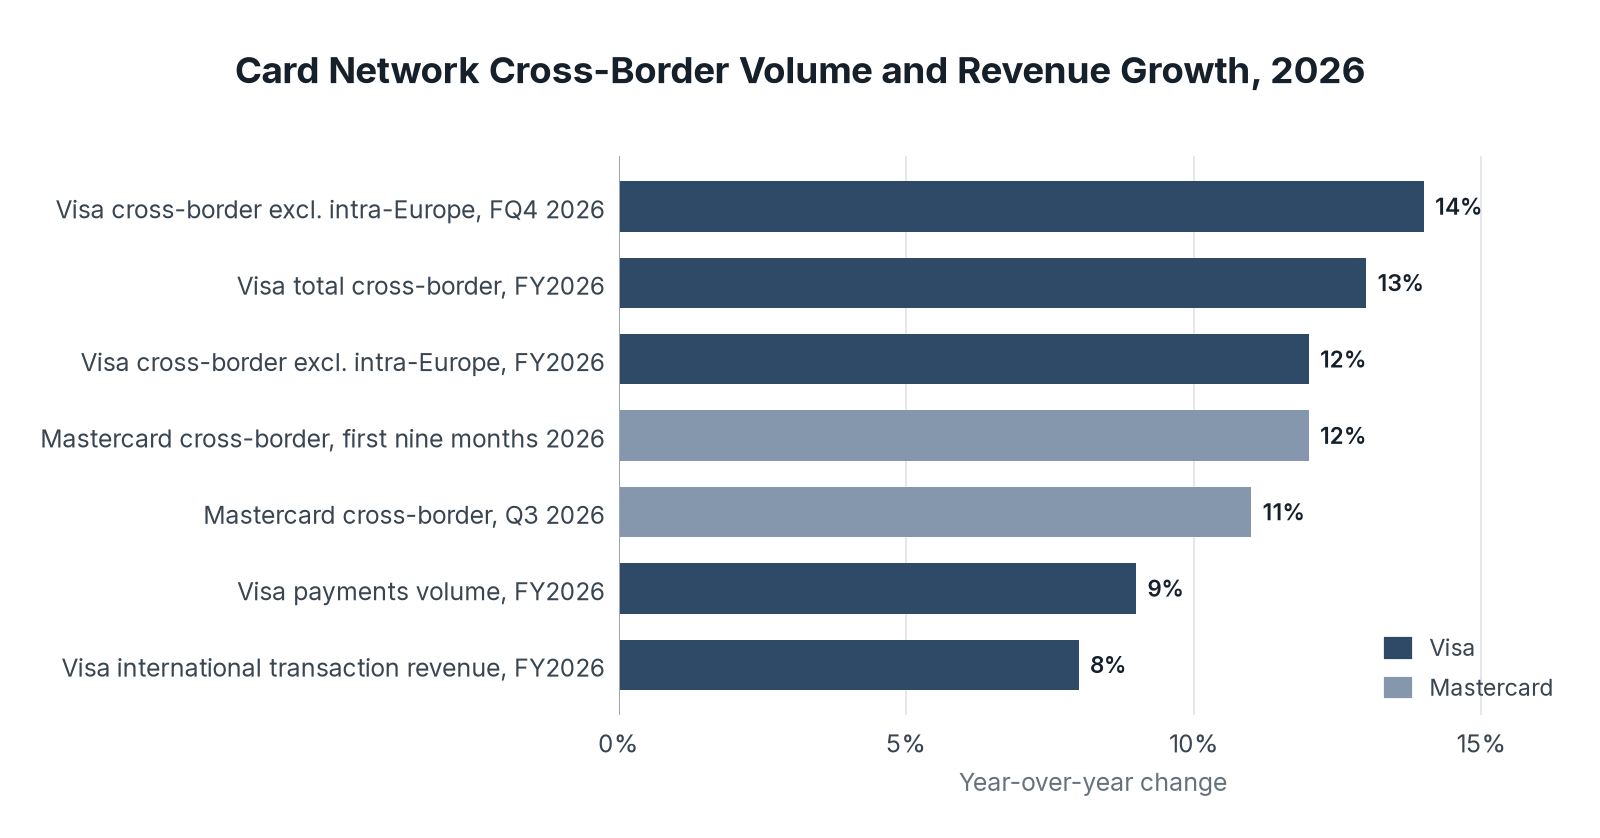
Visa and Mastercard earn separate fees on card payments that cross a border, which Visa reports as international transaction revenue, so their cross-border volume shows how fast this spending is growing. We gathered the growth figures each network reported for its most recent quarter and year to date.
| Network | Measure | Period | Year-over-year change | Basis |
|---|---|---|---|---|
| Visa | Cross-border volume excluding intra-Europe | Fiscal Q4 2026 (July to September) | 14% | Constant dollar |
| Visa | Cross-border volume excluding intra-Europe | Fiscal 2026 | 12% | Constant dollar |
| Visa | Total cross-border volume | Fiscal 2026 | 13% | Constant dollar |
| Visa | Payments volume | Fiscal 2026 | 9% | Constant dollar |
| Visa | International transaction revenue ($15.3B) | Fiscal 2026 | 8% | Nominal US dollars |
| Mastercard | Cross-border volume | Q3 2026 | 11% | Local currency |
| Mastercard | Cross-border volume | First nine months of 2026 | 12% | Local currency |
Key Findings
- Visa's cross-border volume excluding intra-Europe grew 14% in its fiscal fourth quarter, the three months to September 30, 2026, up from 12% for the full fiscal year. Mastercard's cross-border volume grew 11% in the same quarter.
- Visa's international transaction revenue grew 8% to $15.3 billion in fiscal 2026, slower than the 12% growth in the cross-border volume that drives it.
- Visa counts growth in constant dollars and Mastercard in local currency, so the two networks' rates are close but not strictly comparable.
What Cross-Border Fees Mean For Businesses And Senders In 2026
For a business paying abroad, the choice of provider and plan makes a measurable difference: published card fees at rated accounts run from 0% to 3%, and conversion fees from 0.002% to 1%. Across the market, the FSB's averages for retail payments stayed between 1.5% and 2.6% from 2023 to 2025. The exchange rate made up most of that cost, and only 43.2% of business-to-business payment services were transparent about both cost and speed in 2025.
Cross-border card volume is still growing at double-digit rates at both networks, and the G20 deadlines for cheaper payments arrive at the end of 2027 and, for remittances, in 2030. The FSB's own 2025 assessment is that the global targets are unlikely to be met on time.
So if you send money or spend on cards abroad regularly, compare the published conversion or card fee on each plan, not only the monthly price or the transfer fee.
Data Collection and Methodology
We collected card foreign transaction fees and currency conversion fees from the pricing and fee pages of companies rated on The Fintech Index, opened in October 2026. We included each rated company whose page states a percentage fee for card spending in another currency or for converting currency, giving 17 fee records from 10 companies: nine card fee records from six companies and eight conversion fee records from six companies, with Sharesies and Statrys in both groups. Where a company publishes different fees by plan, each plan is a separate record. Statrys fees are for its Hong Kong business account, and its conversion fees are published as starting rates. Starling's record reflects its statement that it charges no fees of its own for spending abroad. Plooto publishes flat cross-border payment fees but not a conversion markup, so it is not included.
The median card fee is the middle of the nine card records. Dollar examples in the Key Findings are our calculations from the published percentages. The Fintech Index rating is the rounded average of the eight criterion scores on each company's review page.
Retail payment costs and remittance costs are the Financial Stability Board's key performance indicators, built from FXC Intelligence price data for retail payments and from the World Bank's Remittance Prices Worldwide for remittances, as of March or Q1 of each year. The 6.36% global average is from the World Bank's Remittance Prices Worldwide site. Card network growth rates are as each company reported them: Visa in constant dollars, except international transaction revenue in nominal US dollars, and Mastercard on a local currency basis. These are public-company figures.
All money is shown in US dollars. Pleo's international payment fees, published in pounds, were converted at the Federal Reserve H.10 rate of $1.3375 per pound on October 23, 2026.
Terms. B2B is a payment from one business to another, B2P from a business to a person, such as a payout, P2B from a person to a business, such as an online purchase from abroad, and P2P from one person to another, excluding remittances. The SmaRT average is the World Bank's average of the three cheapest qualifying services in each corridor.
Sources
- The Fintech Index analysis of published card foreign transaction fees and currency conversion fees at 10 rated companies, conducted October 2026
- Countingup, Pricing
- Tide, Plans and pricing
- Pleo, Pricing
- Statrys, Pricing
- Sharesies, Pricing and plans
- Starling Bank, Business bank account
- Rho, Pricing
- Stake, Financial Services Guide
- Lightyear, Pricing
- Interactive Brokers, Commissions Spot Currencies
- Financial Stability Board, G20 Roadmap for Cross-border Payments: Consolidated progress report for 2025, October 9, 2025
- Financial Stability Board, G20 Targets for Enhancing Cross-border Payments
- World Bank, Remittance Prices Worldwide
- Visa, Fiscal Fourth Quarter and Full-Year 2026 Financial Results, October 2026
- Mastercard, Third-Quarter 2026 Financial Results, October 29, 2026
- Table, Card Foreign Transaction Fees by Provider and Plan: Source: The Fintech Index analysis of published card fees at rated companies (Source 1), from each company's pricing page (Sources 2 to 7). Data: card_fx_fees.csv
- Chart, Card Foreign Transaction Fees by Provider and Plan: Source: The Fintech Index analysis of published card fees at rated companies, from each company's pricing page.
- Table, Published Currency Conversion Fees at Rated Brokers and Accounts: Source: The Fintech Index analysis of published conversion fees at rated companies (Source 1), from each company's pricing or fee page (Sources 5, 6, and 8 to 11). Data: fx_conversion_fees.csv
- Chart, Published Currency Conversion Fees at Rated Brokers and Accounts: Source: The Fintech Index analysis of published conversion fees at rated companies, from each company's pricing or fee page.
- Table, Average Cost of Retail Cross-Border Payments by Use Case: Source: Financial Stability Board, G20 Roadmap for Cross-border Payments: Consolidated progress report for 2025, October 9, 2025 (Source 12), using FXC Intelligence data as of March of each year. Data: retail_cost_kpis.csv
- Chart, Average Cost of Retail Cross-Border Payments by Use Case: Source: Financial Stability Board, G20 Roadmap for Cross-border Payments: Consolidated progress report for 2025, using FXC Intelligence data.
- Table, Global Remittance Costs and the G20 Target: Source: World Bank, Remittance Prices Worldwide, Q1 2023 to Q1 2025, as reported in the Financial Stability Board's consolidated progress report for 2025 (Sources 12 and 14). Data: remittance_cost_kpis.csv
- Chart, Global Remittance Costs and the G20 Target: Source: World Bank, Remittance Prices Worldwide, as reported by the Financial Stability Board, 2025.
- Table, Card Network Cross-Border Volume and Revenue Growth: Source: Visa, Fiscal Fourth Quarter and Full-Year 2026 Financial Results (Source 15), and Mastercard, Third-Quarter 2026 Financial Results (Source 16). Data: card_network_growth.csv
- Chart, Card Network Cross-Border Volume and Revenue Growth: Source: Visa fiscal 2026 results and Mastercard third-quarter 2026 results. Visa figures are in constant dollars except international transaction revenue, which is in nominal US dollars, and Mastercard figures are on a local currency basis.