Credit Card Interest Rate Statistics: 2026 Report

Our analysts reviewed 47 quarters of Federal Reserve G.19 credit card interest rates at commercial banks from February 2015 to August 2026, the monthly bank prime loan rate for the same period, revolving consumer credit balances, and quarterly credit card delinquency and charge-off rates through Q2 2026, 464 data points in all, to show what carrying a card balance costs as of Q4 2026.
Key Findings
- Banks charged an average of 22.36% on credit card accounts that paid interest in August 2026, up from 13.70% in November 2015 and just short of the 23.37% record set in August 2024.
- The gap between that rate and the bank prime rate reached 15.61 percentage points in August 2026, the widest since the series began in 1994.
- Revolving consumer credit, mostly credit card balances, reached $1.35 trillion in August 2026, up 50.6% from December 2015.
- The credit card charge-off rate at commercial banks fell from a recent peak of 4.69% in Q3 2024 to 3.82% in Q2 2026, still higher than the 3.78% of Q4 2019.
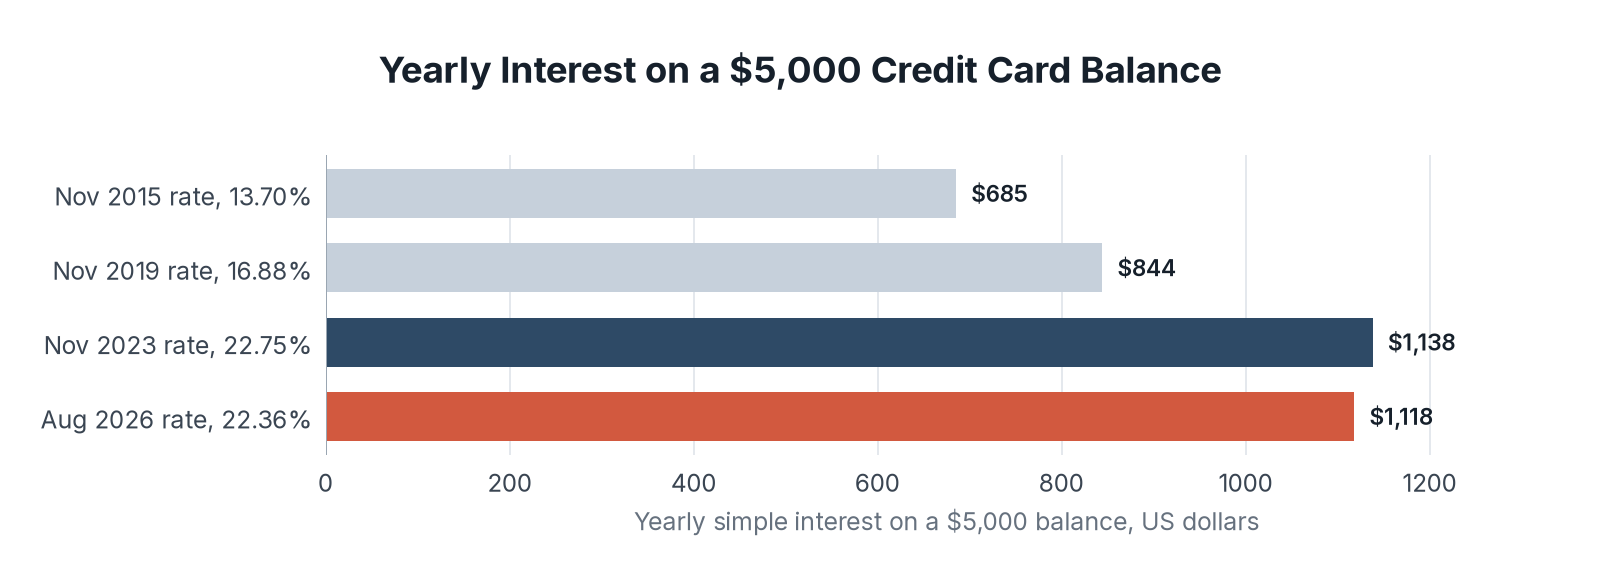
- A $5,000 balance carried for a year at the August 2026 rate costs about $1,118 in simple interest, $433 more than at the November 2015 rate.
Credit card interest is the price of carrying a balance from one month to the next. Card issuers set rates as a margin over the prime rate, which moves with Federal Reserve policy, so card rates rose quickly when the Fed raised rates in 2022 and 2023. They have barely fallen since the Fed began cutting.
We took the average card rates from the Federal Reserve's G.19 Consumer Credit release, which reports two quarterly rates: one on all card accounts and one on accounts that were charged interest. We set those against the monthly bank prime rate, revolving credit balances from the same release, and the Fed's delinquency and charge-off rates on credit card loans at commercial banks.
In the following sections, we compare card rates by year, the gap between card rates and the prime rate, revolving balances, delinquency and charge-off rates, and the yearly interest on a typical balance.
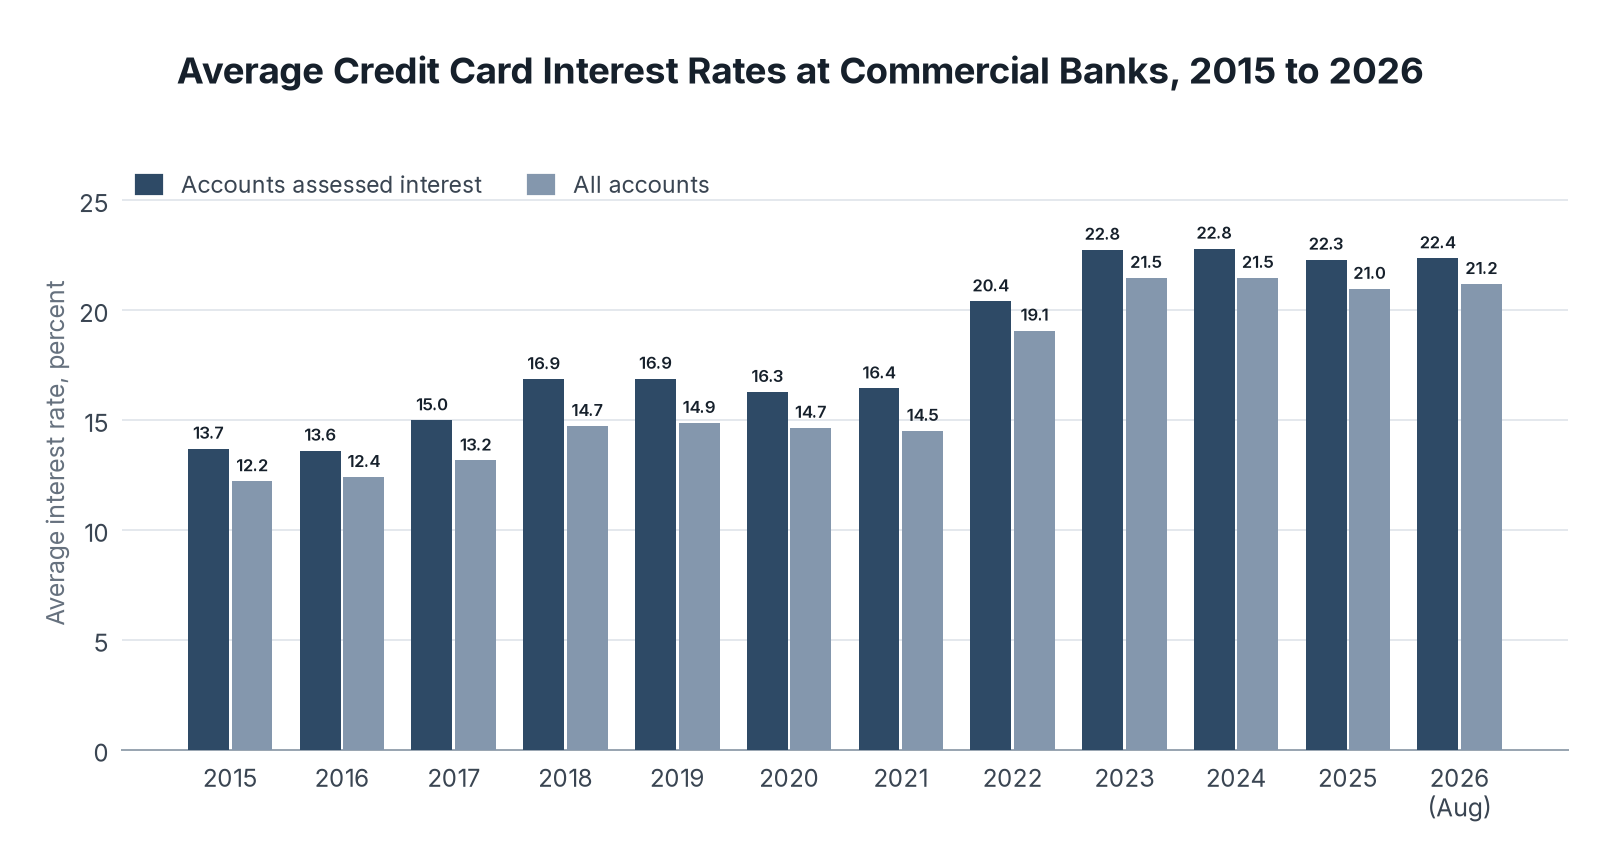
Card Rates Have Held Near 22% Since 2023
The average rate on accounts that were charged interest shows what a cardholder carrying a balance pays. We gathered the November reading for each year from 2015 to 2025 and the latest reading, August 2026, for both G.19 rate series.
| Period | Accounts assessed interest | All accounts |
|---|---|---|
| Nov 2015 | 13.70% | 12.22% |
| Nov 2016 | 13.61% | 12.41% |
| Nov 2017 | 14.99% | 13.16% |
| Nov 2018 | 16.86% | 14.73% |
| Nov 2019 | 16.88% | 14.87% |
| Nov 2020 | 16.28% | 14.65% |
| Nov 2021 | 16.44% | 14.51% |
| Nov 2022 | 20.40% | 19.07% |
| Nov 2023 | 22.75% | 21.47% |
| Nov 2024 | 22.80% | 21.47% |
| Nov 2025 | 22.30% | 20.97% |
| Aug 2026 | 22.36% | 21.19% |
Key Findings
- The rate on accounts assessed interest rose 8.66 percentage points from November 2015 to August 2026, and 6.31 points of that came between November 2021 and November 2023.
- The highest reading on record was 23.37% in August 2024, and every reading since has ranged from 21.52% to 22.83%.
- The rate on all accounts, which includes cardholders who pay in full, was 21.19% in August 2026, 1.17 points lower than the rate on accounts that paid interest.
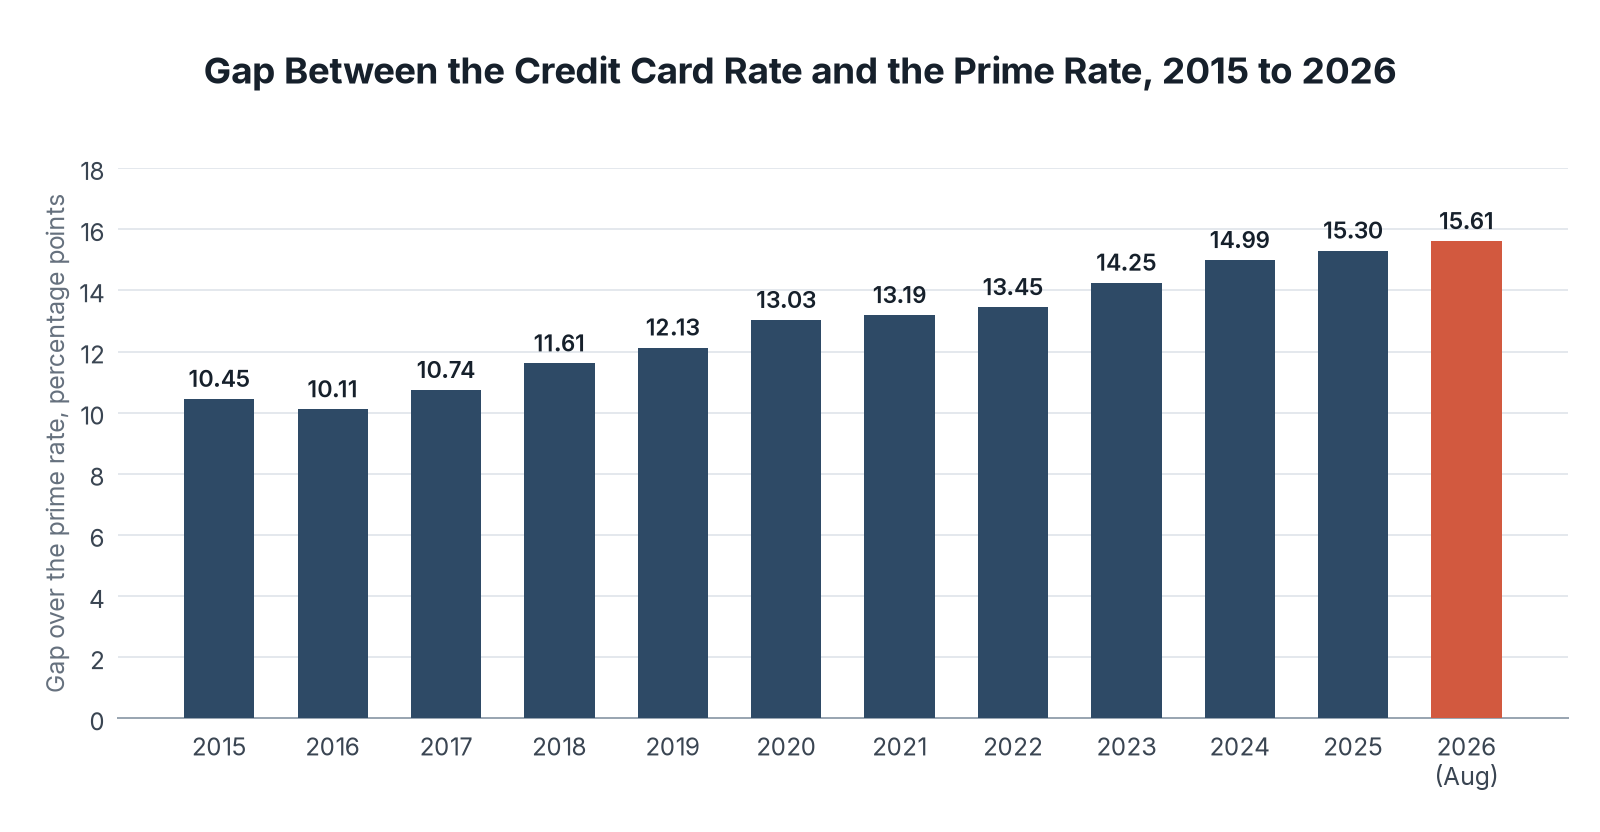
The Gap Over The Prime Rate Is The Widest On Record
The gap between card rates and the prime rate shows how much of the price is the issuer's margin and how much follows Fed policy. We subtracted the bank prime rate for the same month from the rate on accounts assessed interest.
| Period | Accounts assessed interest | Bank prime rate | Gap, percentage points |
|---|---|---|---|
| Nov 2015 | 13.70% | 3.25% | 10.45 |
| Nov 2016 | 13.61% | 3.50% | 10.11 |
| Nov 2017 | 14.99% | 4.25% | 10.74 |
| Nov 2018 | 16.86% | 5.25% | 11.61 |
| Nov 2019 | 16.88% | 4.75% | 12.13 |
| Nov 2020 | 16.28% | 3.25% | 13.03 |
| Nov 2021 | 16.44% | 3.25% | 13.19 |
| Nov 2022 | 20.40% | 6.95% | 13.45 |
| Nov 2023 | 22.75% | 8.50% | 14.25 |
| Nov 2024 | 22.80% | 7.81% | 14.99 |
| Nov 2025 | 22.30% | 7.00% | 15.30 |
| Aug 2026 | 22.36% | 6.75% | 15.61 |
Key Findings
- The gap widened in every year from 2016 to August 2026, from 10.11 to 15.61 percentage points.
- The prime rate fell 1.75 points from its 8.50% peak to 6.75% by August 2026, while the card rate on accounts assessed interest fell only 0.39 points from November 2023.
- The four widest gaps since 1994 all came in 2025 and 2026.
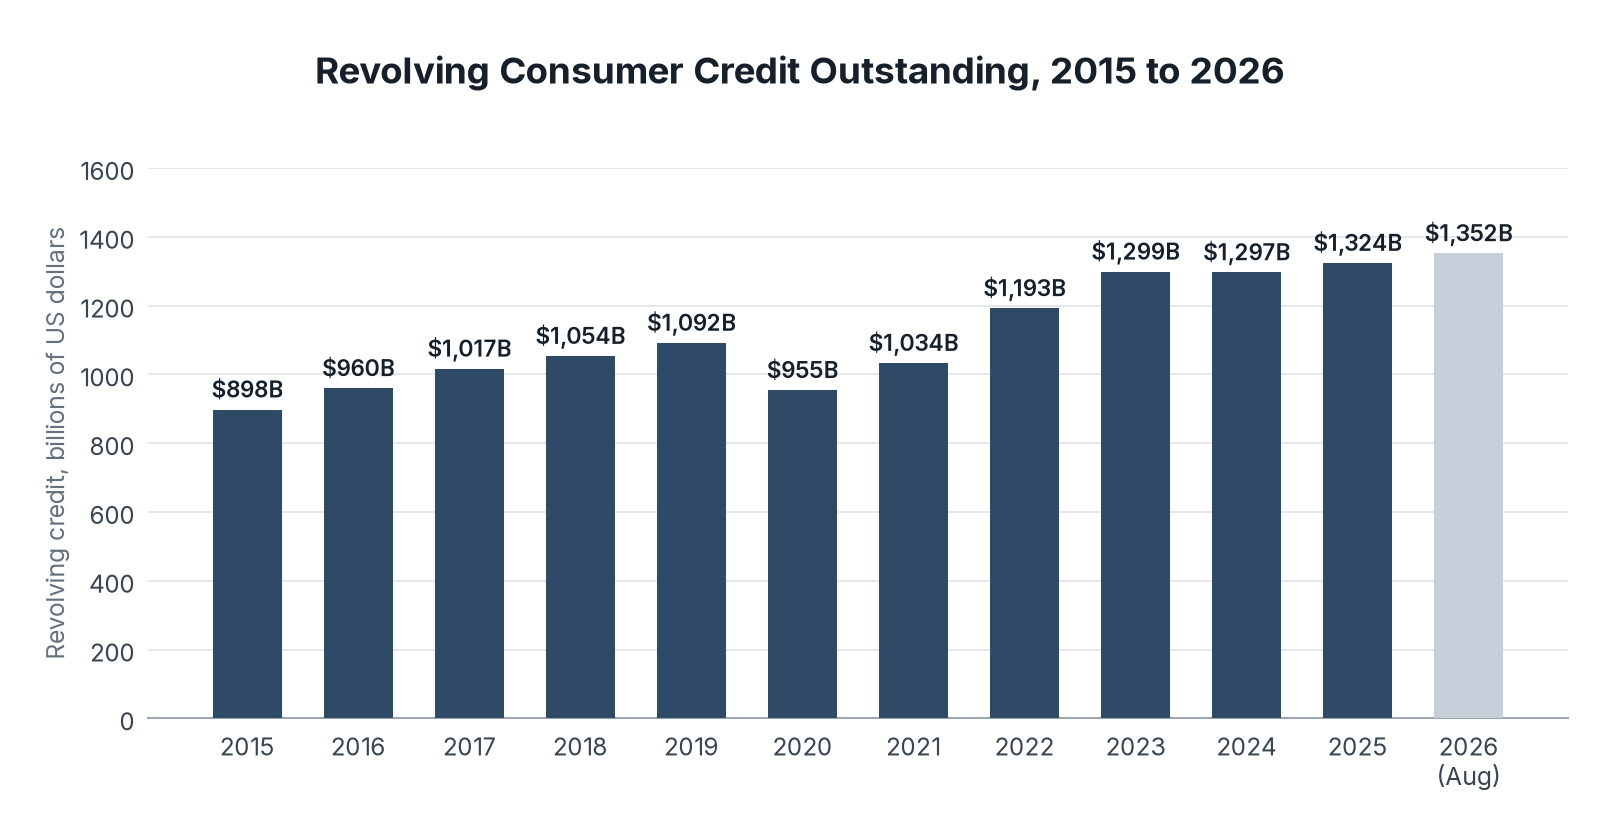
Revolving Balances Have Passed $1.35 Trillion
Revolving credit balances show how much debt the rates apply to. We gathered seasonally adjusted revolving consumer credit for December of each year from 2015 to 2025 and for August 2026.
| Period | Revolving credit, billions of US dollars |
|---|---|
| Dec 2015 | $898.1 |
| Dec 2016 | $960.1 |
| Dec 2017 | $1,016.8 |
| Dec 2018 | $1,053.8 |
| Dec 2019 | $1,092.0 |
| Dec 2020 | $954.6 |
| Dec 2021 | $1,033.5 |
| Dec 2022 | $1,192.6 |
| Dec 2023 | $1,298.9 |
| Dec 2024 | $1,297.0 |
| Dec 2025 | $1,324.3 |
| Aug 2026 | $1,352.4 |
Key Findings
- Revolving credit fell 12.6% in 2020, from $1,092.0 billion to $954.6 billion, as households paid down cards during the pandemic.
- Balances then grew 36.1% from December 2020 to December 2023, the same years card rates rose most.
- Growth slowed after 2023, and revolving credit rose 4.1% from December 2023 to August 2026.
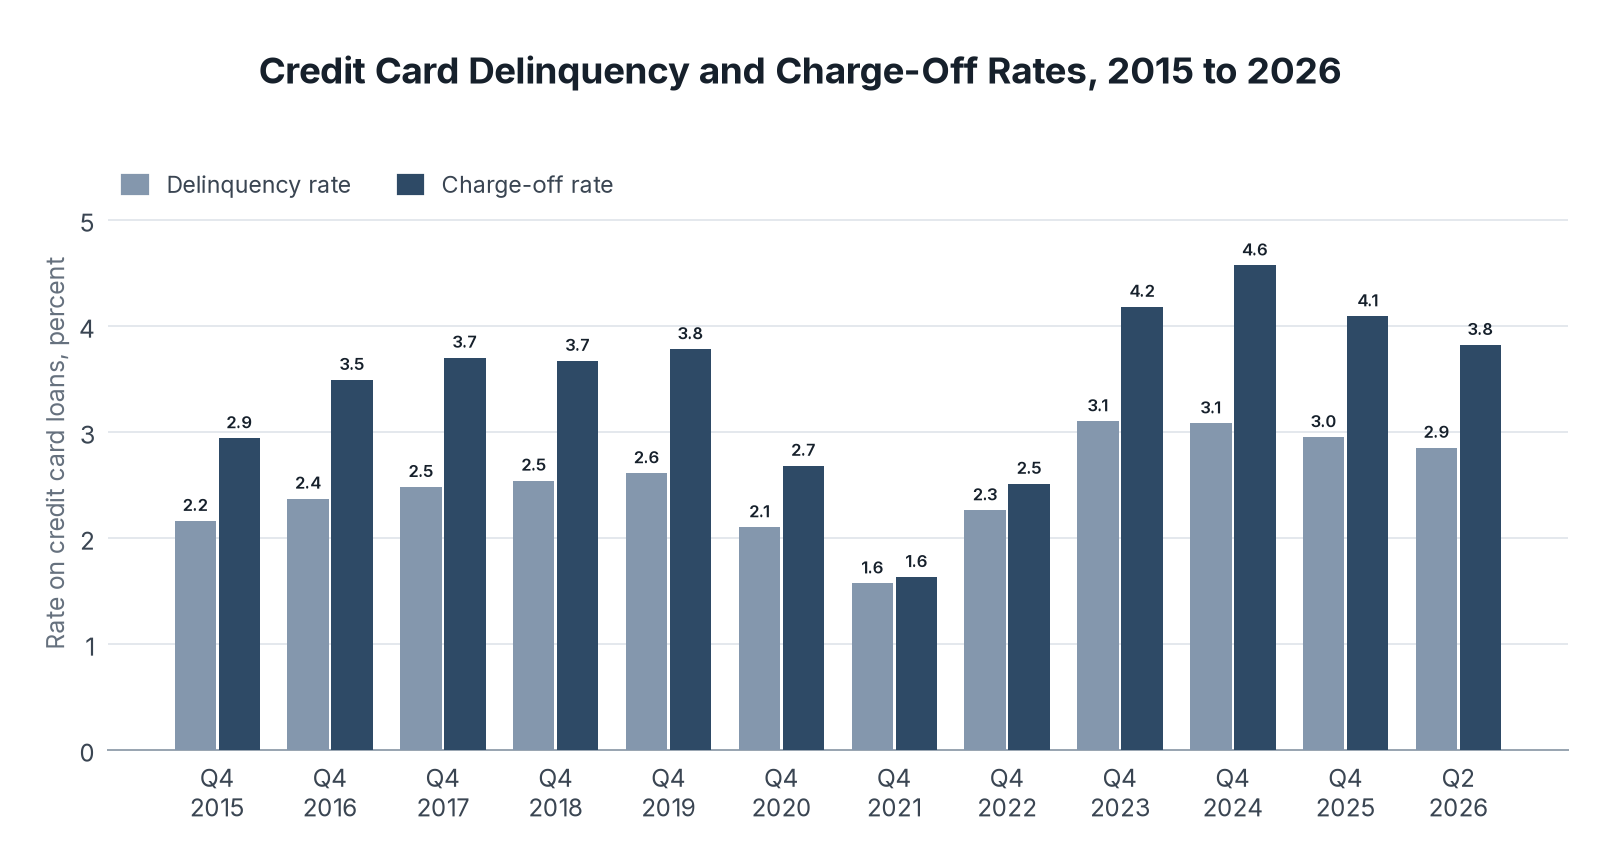
Card Losses Have Eased But Remain Higher Than Before The Pandemic
Delinquency and charge-off rates show how many cardholders fall behind and how much banks write off. We gathered both rates for credit card loans at all commercial banks for Q4 of each year and for Q2 2026, the latest quarter.
| Quarter | Delinquency rate | Charge-off rate |
|---|---|---|
| Q4 2015 | 2.16% | 2.94% |
| Q4 2016 | 2.37% | 3.49% |
| Q4 2017 | 2.48% | 3.70% |
| Q4 2018 | 2.54% | 3.67% |
| Q4 2019 | 2.61% | 3.78% |
| Q4 2020 | 2.10% | 2.68% |
| Q4 2021 | 1.57% | 1.63% |
| Q4 2022 | 2.26% | 2.51% |
| Q4 2023 | 3.10% | 4.18% |
| Q4 2024 | 3.08% | 4.57% |
| Q4 2025 | 2.95% | 4.09% |
| Q2 2026 | 2.85% | 3.82% |
Key Findings
- The charge-off rate more than doubled from 1.63% in Q4 2021 to 4.18% in Q4 2023, and reached a recent peak of 4.69% in Q3 2024.
- By Q2 2026 the charge-off rate had fallen to 3.82%, close to the 3.78% of Q4 2019.
- The delinquency rate was 2.85% in Q2 2026, down from 3.22% in Q2 2024 but higher than every Q4 reading from 2015 to 2022.
A $5,000 Balance Now Costs About $1,100 A Year In Interest
The interest on one balance shows what the rate changes mean for a household. We applied the rate on accounts assessed interest to a $5,000 balance carried for one year, using simple interest.
| Period | Rate on accounts assessed interest | Yearly interest, US dollars |
|---|---|---|
| Nov 2015 | 13.70% | $685 |
| Nov 2019 | 16.88% | $844 |
| Nov 2023 | 22.75% | $1,138 |
| Aug 2026 | 22.36% | $1,118 |
Key Findings
- At the August 2026 rate, a $5,000 balance costs about $1,118 a year in simple interest, 63.2% more than the $685 it cost at the November 2015 rate.
- The same balance costs $274 more a year than at the November 2019 rate, before the Fed's 2022 increases.
- Monthly compounding adds to the cost, so the figures here are a floor for a cardholder who carries the full balance all year.
What Card Rate Data Means For Borrowers In 2026
Card rates rose with the Fed's increases in 2022 and 2023 but have not followed its cuts, so the average rate on balances is still about 22% and the gap over the prime rate is the widest on record. Balances have grown past $1.35 trillion, and charge-offs, while lower than in 2024, remain at pre-pandemic levels.
If the prime rate keeps falling and issuers keep their margins, card rates will drop only slowly. Lower-rate cards, balance transfers, and installment loans give cardholders who carry balances the clearest way to pay less.
So if you carry a credit card balance from month to month, compare your card's rate with the 22.36% bank average and move the balance if you can get a lower one.
Data Collection and Methodology
Credit card interest rates come from the Federal Reserve's G.19 Consumer Credit release, which reports two rates for credit card plans at commercial banks each quarter, in February, May, August, and November: one on all accounts and one on accounts that were assessed interest. Both series are not seasonally adjusted. We used the November reading for each year from 2015 to 2025 and the August 2026 reading, the latest in the G.19 release of October 7, 2026. The rate on accounts assessed interest series begins in November 1994.
The gap over the prime rate is our calculation: the rate on accounts assessed interest minus the monthly average bank prime loan rate from the Federal Reserve's H.15 release for the same month. Revolving consumer credit is the seasonally adjusted month-end level from the G.19 release. Delinquency and charge-off rates are seasonally adjusted quarterly rates on credit card loans at all commercial banks, from the Federal Reserve's charge-off and delinquency release. We pulled every series from FRED, the St. Louis Fed database, on November 4, 2026.
Yearly interest on a $5,000 balance is our calculation: the balance times the rate on accounts assessed interest for one year, before monthly compounding. All figures are in US dollars, so no currency conversion was needed.
Sources
- The Fintech Index analysis of Federal Reserve credit card rate, prime rate, revolving credit, delinquency, and charge-off data, conducted November 2026
- Federal Reserve Bank of St. Louis, FRED, Commercial Bank Interest Rate on Credit Card Plans, Accounts Assessed Interest (TERMCBCCINTNS)
- Federal Reserve Bank of St. Louis, FRED, Commercial Bank Interest Rate on Credit Card Plans, All Accounts (TERMCBCCALLNS)
- Federal Reserve, G.19 Consumer Credit, October 7, 2026
- Federal Reserve Bank of St. Louis, FRED, Bank Prime Loan Rate (MPRIME)
- Federal Reserve Bank of St. Louis, FRED, Revolving Consumer Credit Owned and Securitized (REVOLSL)
- Federal Reserve Bank of St. Louis, FRED, Delinquency Rate on Credit Card Loans, All Commercial Banks (DRCCLACBS)
- Federal Reserve Bank of St. Louis, FRED, Charge-Off Rate on Credit Card Loans, All Commercial Banks (CORCCACBS)
- Table, Average Credit Card Interest Rates at Commercial Banks: Source: Federal Reserve, G.19 Consumer Credit (Sources 2 to 4). Data: credit_card_rates_by_year.csv
- Chart, Average Credit Card Interest Rates at Commercial Banks: Source: Federal Reserve, G.19 Consumer Credit release, via FRED. Commercial banks, not seasonally adjusted.
- Table, Credit Card Rate Compared With the Prime Rate: Source: Federal Reserve, G.19 Consumer Credit and H.15 Selected Interest Rates (Sources 2, 3, and 5), and The Fintech Index analysis (Source 1). Data: credit_card_rates_by_year.csv
- Chart, Credit Card Rate Compared With the Prime Rate: Source: Federal Reserve, G.19 Consumer Credit release and H.15 bank prime loan rate, via FRED. The Fintech Index calculation.
- Table, Revolving Consumer Credit Outstanding: Source: Federal Reserve, G.19 Consumer Credit (Sources 2 and 6). Data: revolving_credit_outstanding.csv
- Chart, Revolving Consumer Credit Outstanding: Source: Federal Reserve, G.19 Consumer Credit release, via FRED. Seasonally adjusted.
- Table, Credit Card Delinquency and Charge-Off Rates at Commercial Banks: Source: Federal Reserve, Charge-Off and Delinquency Rates on Loans and Leases at Commercial Banks (Sources 7 and 8). Data: credit_card_delinquency_chargeoff.csv
- Chart, Credit Card Delinquency and Charge-Off Rates at Commercial Banks: Source: Federal Reserve, Charge-Off and Delinquency Rates on Loans and Leases at Commercial Banks, via FRED. Seasonally adjusted.
- Table, Yearly Interest on a $5,000 Credit Card Balance: Source: The Fintech Index analysis (Source 1) of Federal Reserve G.19 rates (Source 2). Simple interest for one year, before monthly compounding. Data: interest_cost_on_5000_balance.csv
- Chart, Yearly Interest on a $5,000 Credit Card Balance: Source: The Fintech Index calculation from Federal Reserve G.19 rates on accounts assessed interest. Simple interest for one year, before compounding.