Credit Application Rejection Rates: 2026 Report
How often are US credit applications turned down, and which applicants are turned down most? We recalculated rejection rates for cards, auto loans, mortgages and limit increases from two Federal Reserve surveys and federal mortgage records.

The Federal Reserve's May 2026 household survey found that one in three US adults who applied for credit in 2025 was turned down or approved for less than requested (n=4,276 applicants in our recalculation). In October 2025, a separate New York Fed survey recorded its highest rejection rate since the series began in 2013, then a sharp drop in early 2026. That swing led us to study what share of US credit applicants are rejected, which applicants face the highest rates and how much the rates differ by product.
Our analysts studied three federal data sources. We recalculated rejection rates from the New York Fed Survey of Consumer Expectations (SCE) Credit Access Survey microdata, applied the survey weights to the Federal Reserve Survey of Household Economics and Decisionmaking (SHED) public files for 2020 to 2025 and pulled 2018 to 2025 nationwide mortgage decisions from Home Mortgage Disclosure Act (HMDA) records. In the following sections, we compare overall rejection rates, rates by product and credit score, gaps by race, income and age, and mortgage denial rates by loan purpose, loan type and applicant race.
How Often Credit Applications Are Rejected
This section sets out the annual and survey-wave rejection rates for all types of consumer credit combined.
The SHED asks each adult whether they applied for any credit in the prior 12 months and, if so, whether they were turned down or approved for less. Table 1 shows our recalculation of those measures from the public files.
| Year | Adults surveyed (n) | Applied for any credit | Applicants (n) | Denied or approved for less | Turned down | Approved for less | Put off applying for other credit |
|---|---|---|---|---|---|---|---|
| 2020 | 11,648 | 36.7% | 4,275 | 30.8% | 23.8% | 17.1% | 18.4% |
| 2021 | 11,874 | 37.6% | 4,413 | 27.8% | 21.7% | 16.1% | 17.1% |
| 2022 | 11,667 | 34.9% | 4,016 | 30.2% | 24.3% | 15.6% | 17.9% |
| 2023 | 11,400 | 35.6% | 4,007 | 32.3% | 24.8% | 17.1% | 19.8% |
| 2024 | 12,295 | 33.6% | 4,111 | 32.8% | 25.6% | 17.4% | 19.6% |
| 2025 | 12,934 | 33.5% | 4,276 | 33.1% | 25.7% | 18.7% | 19.3% |
Source: Fintech Index Credit Application Rejection Rate Study (Source 1), from Federal Reserve SHED public data (Source 3) and the Federal Reserve report on 2025 household well-being (Source 4). Weighted shares are our calculation. "Turned down" and "approved for less" overlap because an applicant can report both.
Data: shed_annual_2020_2025.csv
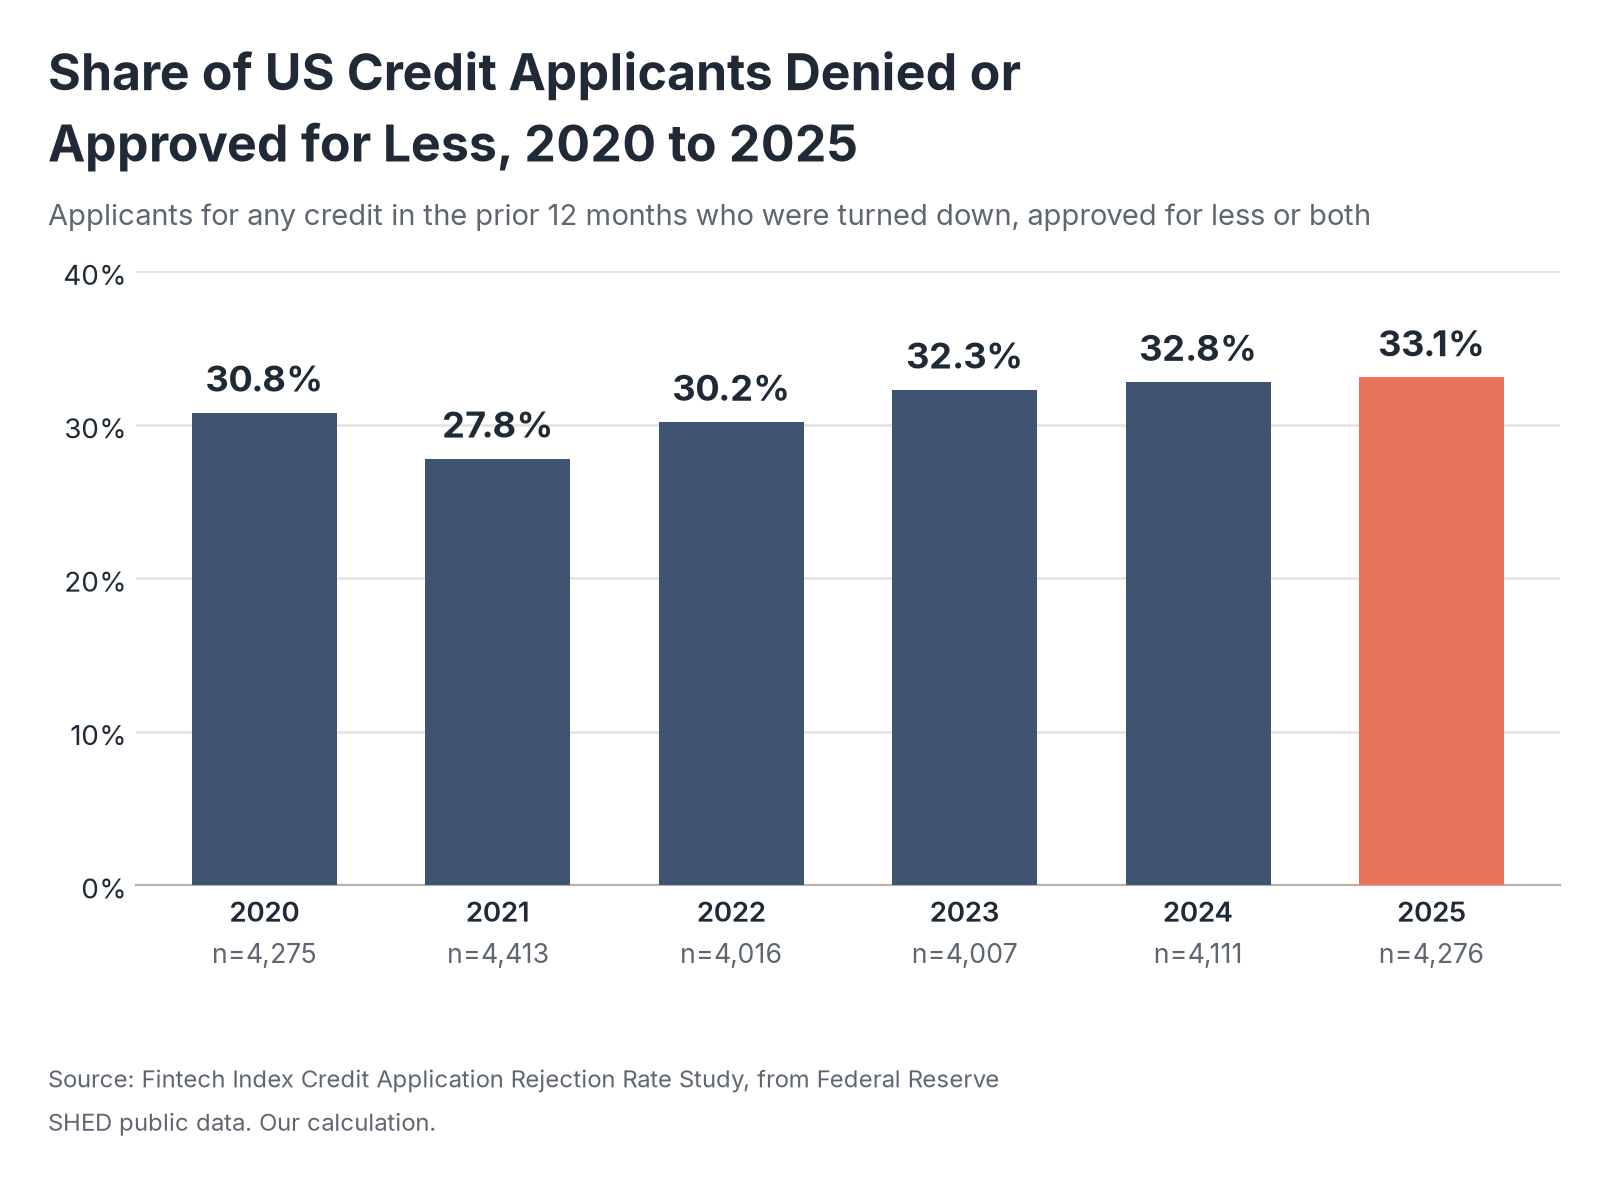
- The combined denial measure rose in every year after 2021, while the share of adults applying for credit fell by about four points over the same span.
- About one in five applicants in each year also held back from a different credit application because they expected a denial, so the recorded rejection rate understates how many people were shut out.
- Among all adults in 2025, 4.4% wanted credit but did not apply at all because they expected to be turned down (n=12,934).
The SCE fields its Credit Access Survey three times a year, in February, June and October, and reports the share of applicants rejected on at least one application over the prior 12 months. Table 2 covers the eight most recent waves published by the New York Fed.
| Survey wave | Respondents (n) | Applied for any credit | Rejected at least once (applicants) | Discouraged from applying | Lender closed an account |
|---|---|---|---|---|---|
| Feb 2024 | 980 | 43.4% | 18.7% | 6.1% | 6.7% |
| Jun 2024 | 944 | 41.2% | 21.4% | 5.5% | 7.3% |
| Oct 2024 | 970 | 41.6% | 22.9% | 6.6% | 8.1% |
| Feb 2025 | 856 | 41.7% | 21.5% | 8.5% | 7.0% |
| Jun 2025 | 971 | 42.2% | 23.1% | 7.2% | 8.0% |
| Oct 2025 | 919 | 41.1% | 24.8% | 8.0% | 8.8% |
| Feb 2026 | 923 | 44.4% | 15.9% | 8.3% | 9.1% |
| Jun 2026 | 895 | 46.1% | 16.1% | 5.2% | 7.0% |
Source: Fintech Index Credit Application Rejection Rate Study (Source 1), from New York Fed SCE Credit Access Survey chart data (Source 2). The rejection column is a share of applicants, and the other rate columns are shares of all respondents.
Data: sce_published_waves_2013_2026.csv
- The October 2025 wave is the highest rejection reading in the series since it began in October 2013, and the February 2026 wave is the lowest since June 2021.
- Applicants in both 2026 waves were rejected less often than in any 2024 or 2025 wave. Each reading covers the prior 12 months, so the lower rates reflect credit decisions made between early 2025 and mid-2026.
- The share of respondents whose lender closed an account reached its highest level in the table in February 2026, in the same wave the rejection rate fell.
Rejection Rates by Credit Product
This section breaks rejection rates out by type of credit, using both surveys because each covers a different product mix.
The SHED asks applicants which types of credit they sought and whether they were turned down or offered less on each one. Table 3 shows the four years in which the product questions appear in their current form.
| Product | 2022 | 2023 | 2024 | 2025 | 2025 applicants (n) |
|---|---|---|---|---|---|
| Credit card | 31.4% | 32.6% | 35.1% | 33.8% | 3,015 |
| Home equity line of credit | 16.9% | 25.0% | 26.5% | 28.1% | 301 |
| Auto loan | 15.8% | 18.0% | 16.6% | 19.2% | 1,066 |
| Mortgage | 9.6% | 17.0% | 17.1% | 16.4% | 448 |
| Student loan | 11.5% | 15.6% | 15.8% | 16.2% | 265 |
Source: Fintech Index Credit Application Rejection Rate Study (Source 1), from Federal Reserve SHED public data (Source 3). Weighted shares are our calculation. Applicant n for 2022, 2023 and 2024 were 2,719, 2,761 and 2,864 for cards; 237, 249 and 268 for home equity lines; 961, 932 and 937 for auto loans; 669, 416 and 422 for mortgages; and 257, 269 and 284 for student loans.
Data: shed_by_product_2022_2025.csv
- Home equity lines show the steepest climb of any product, with each year above the one before.
- About seven in ten 2025 applicants sought a credit card (our calculation, base n=4,276), so the card rate carries the most weight in the overall SHED measure in Table 1.
- The mortgage rate jumped between 2022 and 2023 as the number of mortgage applicants in the sample fell by more than a third (our calculation, base n=669 in 2022 and n=416 in 2023).
The SCE asks separately about card applications, mortgage and home-based loans, auto loans and requests to raise a card limit, and records a rejection only when the application was turned down in full. Table 4 pools all waves in each calendar year from the respondent-level microdata.
| Year | Credit card | Card applicants (n) | Mortgage or home-based loan | Mortgage applicants (n) | Auto loan | Auto applicants (n) | Card limit increase | Limit requests (n) |
|---|---|---|---|---|---|---|---|---|
| 2019 | 16.4% | 946 | 10.3% | 284 | 7.2% | 413 | 30.6% | 320 |
| 2020 | 13.8% | 668 | 10.1% | 235 | 7.8% | 425 | 32.0% | 238 |
| 2021 | 20.4% | 749 | 12.3% | 306 | 3.5% | 452 | 31.7% | 263 |
| 2022 | 19.0% | 555 | 14.5% | 169 | 3.8% | 300 | 33.9% | 178 |
| 2023 | 19.6% | 807 | 11.9% | 196 | 10.9% | 395 | 31.0% | 358 |
| 2024 | 20.1% | 796 | 20.6% | 204 | 12.0% | 341 | 39.1% | 343 |
| 2025 (Feb and Jun) | 22.2% | 464 | 13.6% | 127 | 10.0% | 246 | 38.6% | 206 |
Source: Fintech Index Credit Application Rejection Rate Study (Source 1), from New York Fed SCE Credit Access Survey microdata (Source 2). Weighted pooled rates are our calculation. The 2022 microdata contain the February and October waves only.
Data: sce_pooled_by_year_product_our_calc.csv
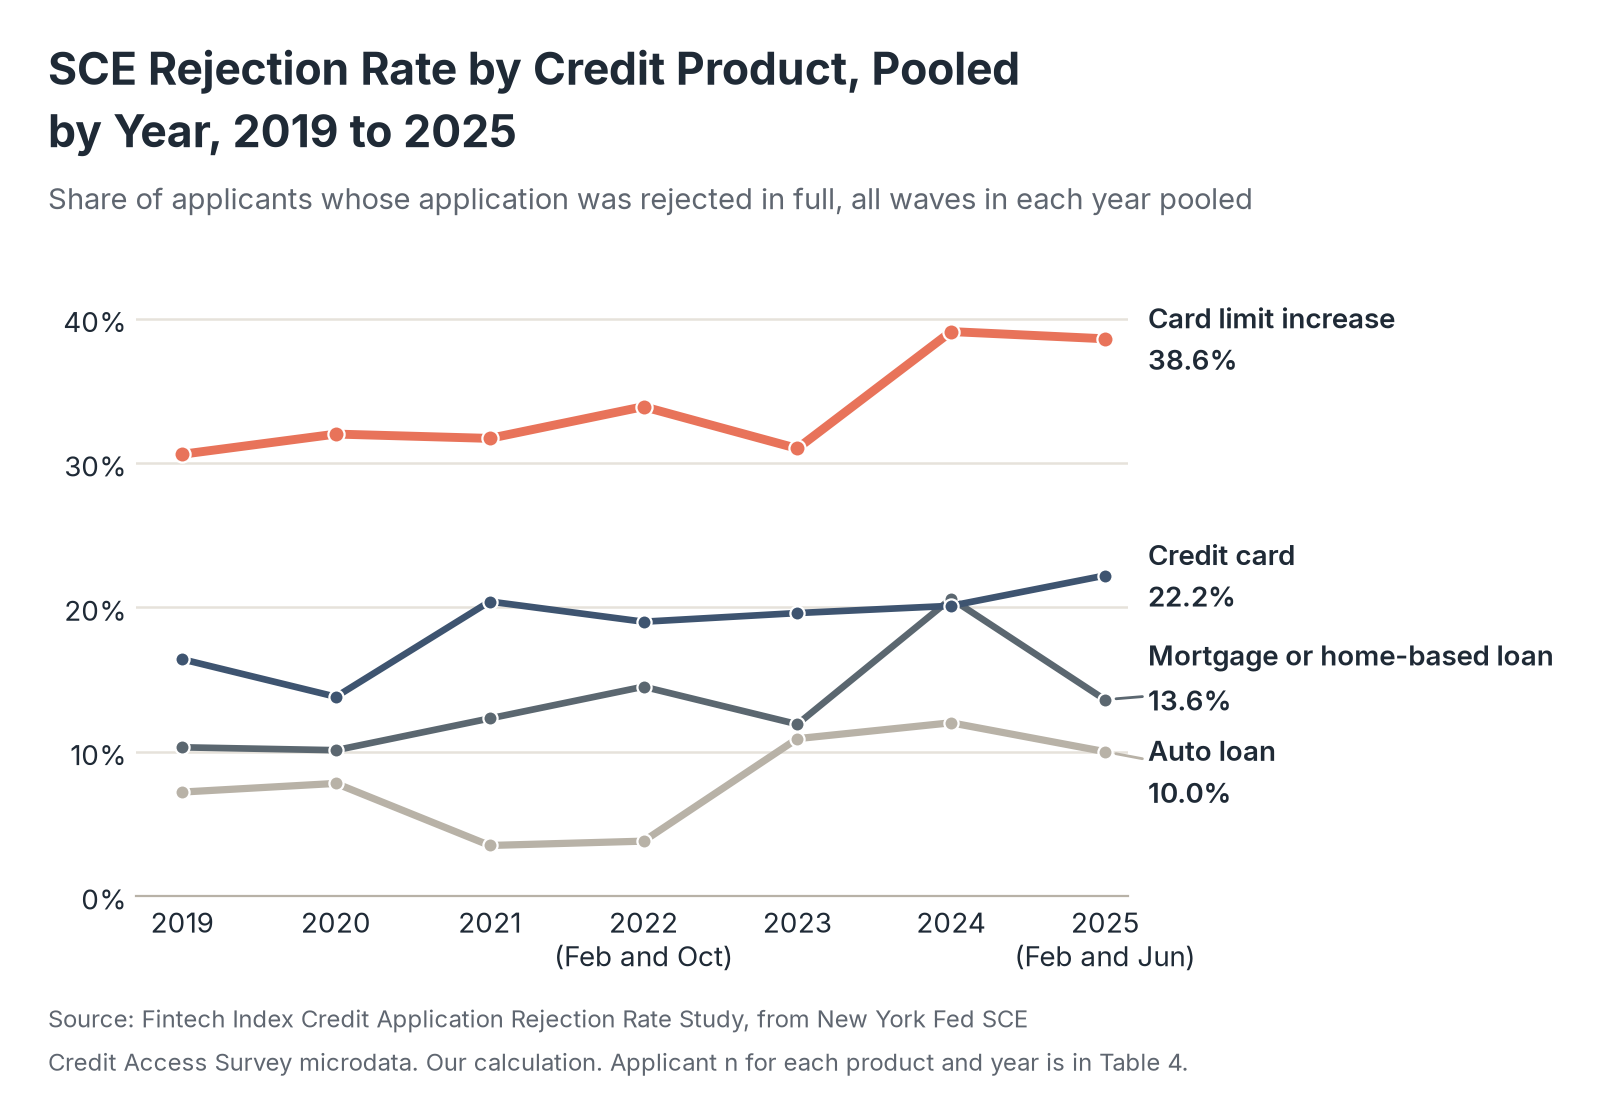
- Requests to raise a card limit were rejected more often than any new-credit application in every year shown.
- Auto loan rejection roughly tripled between 2022 and 2024 (our calculation, base n=300 and n=341 auto applicants), the largest relative increase of any SCE product.
- Partial approvals count as approvals in the SCE, which helps explain why these rates come in below the SHED rates for the same products.
Rejection Rates by Credit Score
This section compares rejection rates across self-reported credit score bands, using pooled SCE microdata to keep the applicant base of each of the five score bands above 200.
SCE respondents report their credit score in one of five ranges or say they do not know it. Table 5 pools the five waves from February 2024 through June 2025, the most recent waves in the public microdata.
| Credit score | Respondents (n) | Applied for any credit | Applicants (n) | Rejected at least once (applicants) | Card rejection rate | Card applicants (n) |
|---|---|---|---|---|---|---|
| Below 620 | 470 | 45.6% | 241 | 64.1% | 63.2% | 174 |
| 620 to 679 | 432 | 52.4% | 243 | 38.4% | 35.8% | 168 |
| 680 to 719 | 433 | 53.4% | 238 | 24.9% | 18.3% | 142 |
| 720 to 760 | 781 | 45.0% | 362 | 6.9% | 5.0% | 220 |
| Above 760 | 2,356 | 38.9% | 948 | 4.8% | 2.9% | 525 |
| Does not know score | 250 | 20.1% | 50 | 36.9% | 35.1% | 31 |
| All respondents | 4,723 | 42.0% | 2,082 | 21.5% | 20.9% | 1,260 |
Source: Fintech Index Credit Application Rejection Rate Study (Source 1), from New York Fed SCE Credit Access Survey microdata (Source 2). Weighted pooled rates are our calculation. The "All respondents" row includes one respondent with no score answer. Rows with fewer than 100 applicants carry wide margins.
Data: sce_by_credit_score_2024_2025_our_calc.csv
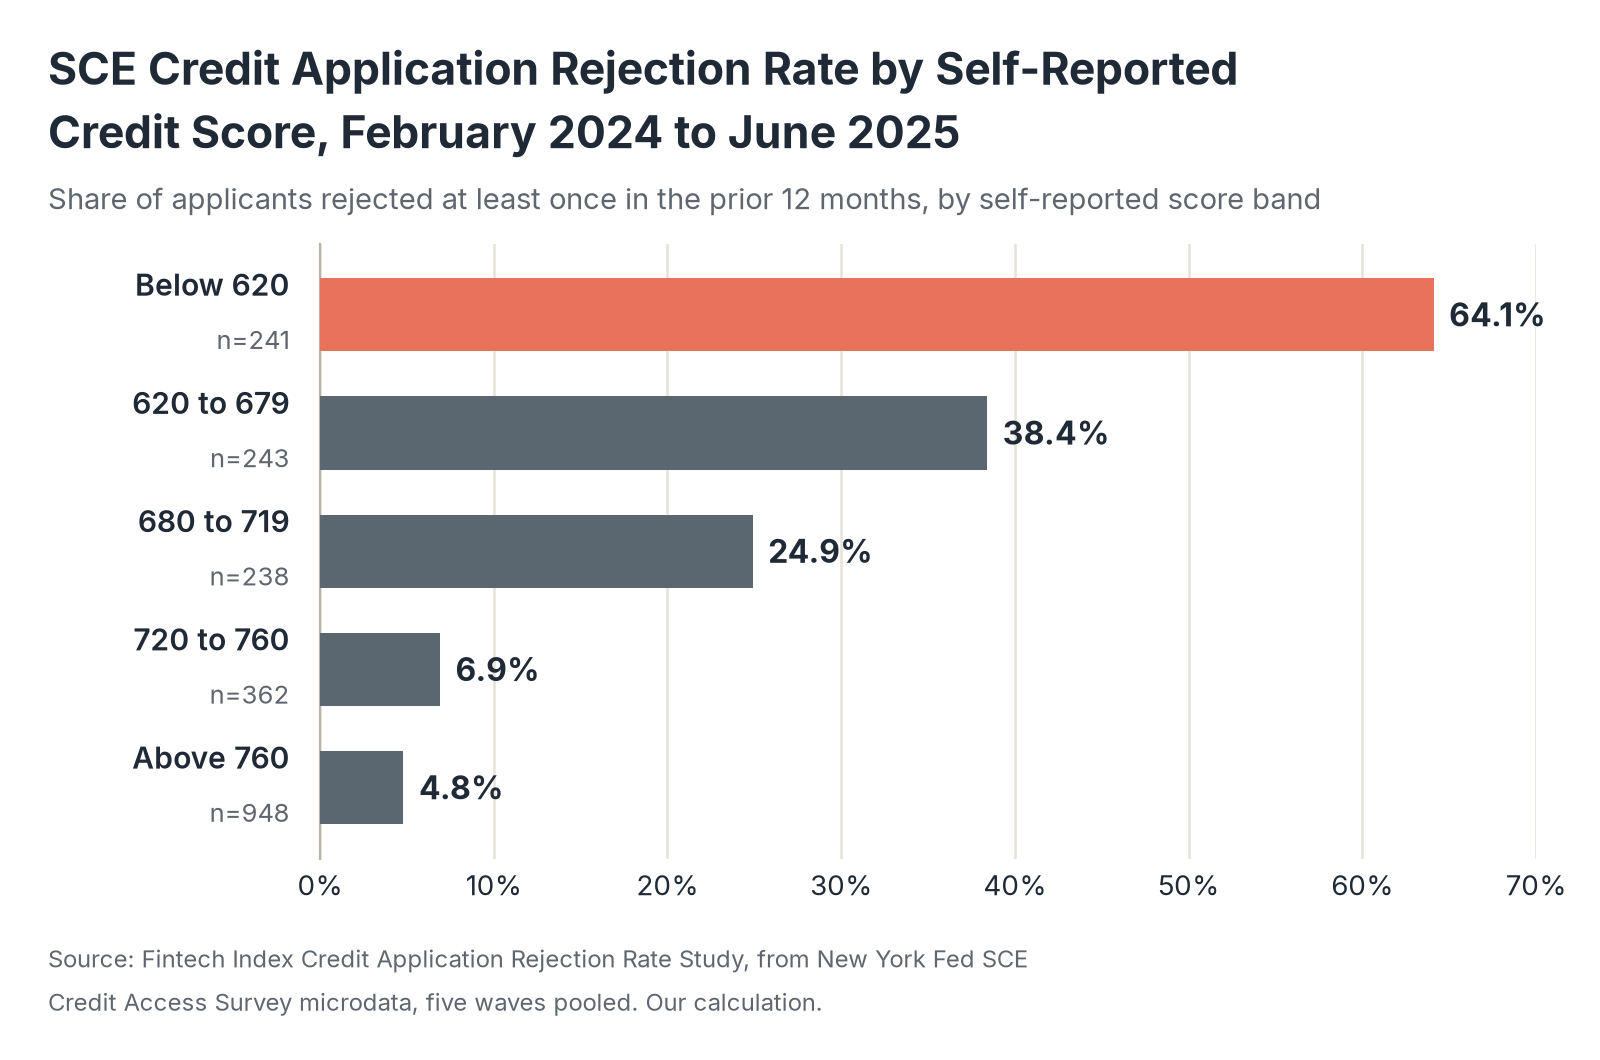
- Applicants who reported a credit score below 620 were rejected about 13 times as often as applicants above 760 (our calculation, base n=241 and n=948 applicants). Rejection also falls by about 18 points between the 680 to 719 and 720 to 760 bands (our calculation, base n=238 and n=362 applicants).
- Respondents with scores below 680 applied for credit more often than those above 760, so weaker profiles make up a larger share of applicants than of all respondents. Respondents who do not know their score apply far less often, and the few who do apply face rejection rates close to the 620 to 679 band.
- Rejection falls by about 26 points from the below 620 band to the 620 to 679 band (our calculation, base n=241 and n=243 applicants), the steepest step in the table.
Rejection Rates by Race, Income and Age
This section compares SHED denial rates across demographic groups for the two most recent survey years.
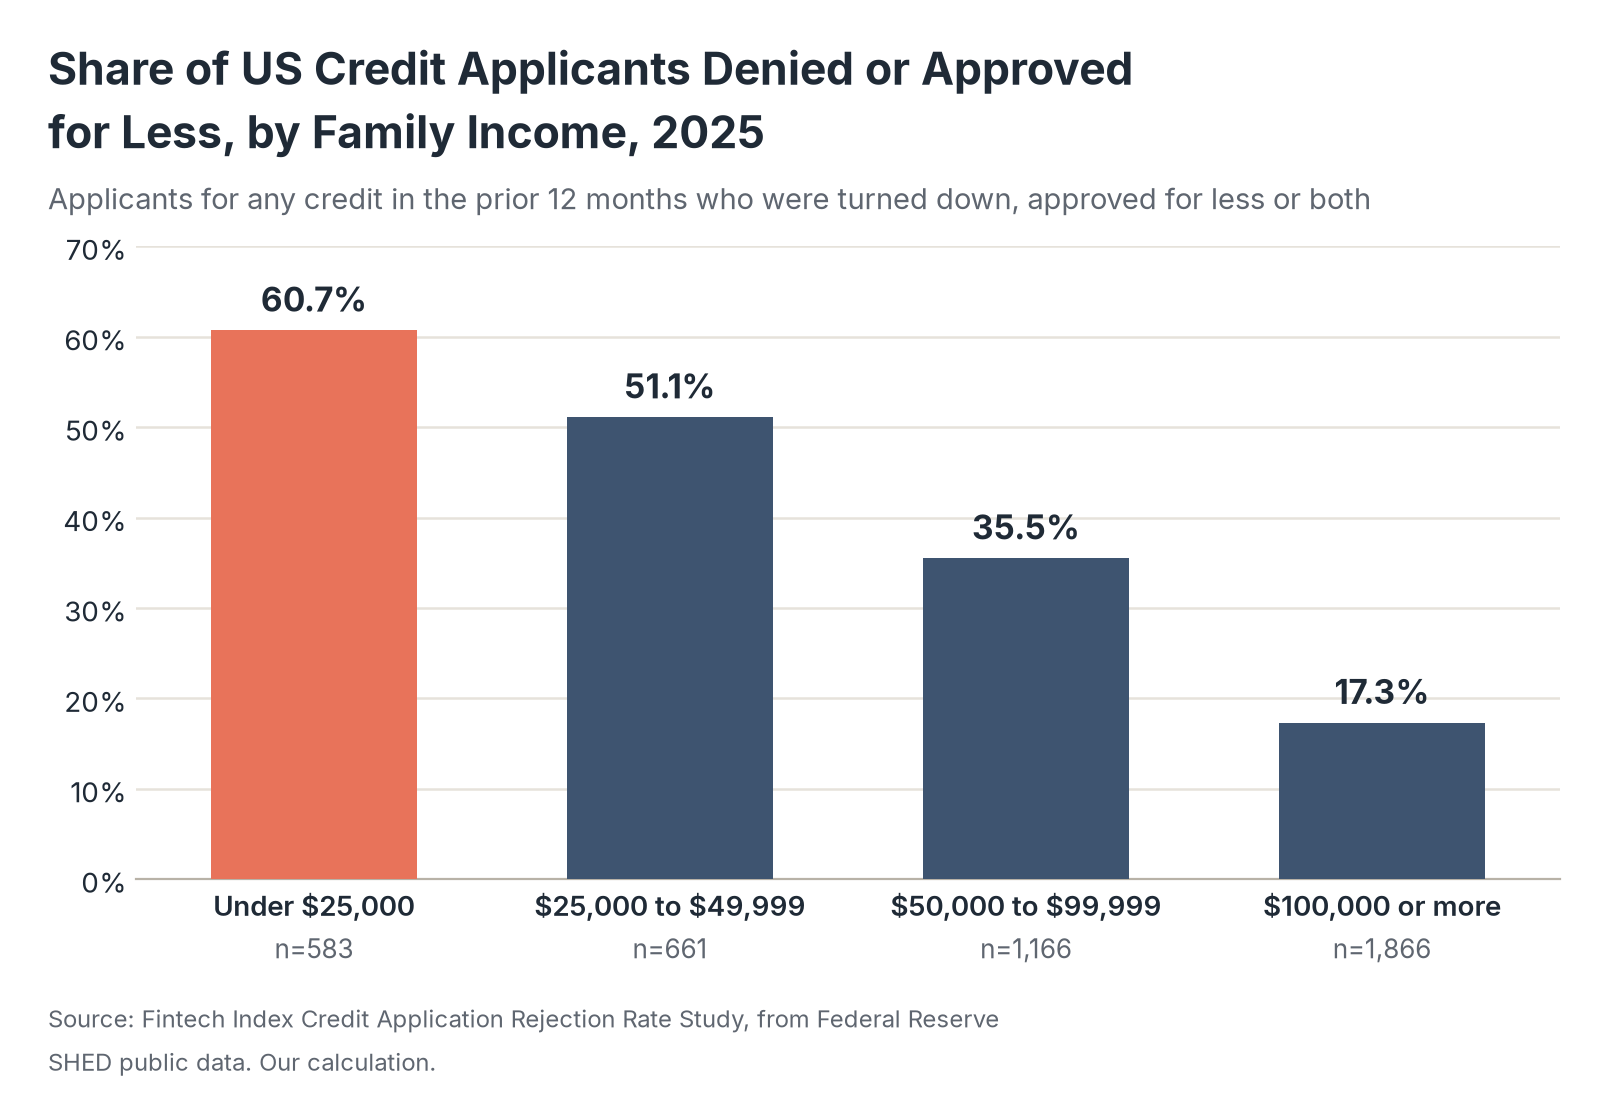
The SHED publishes racial and ethnic denial rates in its annual report, and the public files allow the same measure by family income and age. Table 6 shows our recalculation for 2024 and 2025.
| Group | 2024 | 2024 applicants (n) | 2025 | 2025 applicants (n) | 2025 turned down | Did not apply, expected denial (2025, all adults in group) |
|---|---|---|---|---|---|---|
| White | 25.9% | 2,676 | 24.8% | 2,783 | 19.1% | 3.0% |
| Black | 51.1% | 493 | 53.8% | 517 | 42.3% | 8.2% |
| Hispanic | 44.1% | 574 | 46.3% | 609 | 35.0% | 6.6% |
| Asian | 23.5% | 189 | 25.3% | 241 | 19.6% | 3.0% |
| Under $25,000 | 57.4% | 585 | 60.7% | 583 | 51.2% | 10.1% |
| $25,000 to $49,999 | 50.0% | 615 | 51.1% | 661 | 43.9% | 7.6% |
| $50,000 to $99,999 | 35.1% | 1,155 | 35.5% | 1,166 | 27.1% | 3.8% |
| $100,000 or more | 17.0% | 1,756 | 17.3% | 1,866 | 11.0% | 1.2% |
| Ages 18 to 29 | 41.1% | 691 | 41.6% | 720 | 33.7% | 5.4% |
| Ages 30 to 44 | 37.8% | 1,072 | 38.2% | 1,094 | 30.0% | 6.5% |
| Ages 45 to 59 | 32.9% | 1,078 | 30.9% | 1,134 | 24.2% | 4.3% |
| Ages 60 and older | 19.6% | 1,270 | 23.1% | 1,328 | 16.1% | 2.2% |
Source: Fintech Index Credit Application Rejection Rate Study (Source 1), from Federal Reserve SHED public data (Source 3) and the Federal Reserve report on 2025 household well-being (Source 4). Weighted shares are our calculation. White, Black and Asian groups exclude Hispanic respondents. The 2025 adult bases were 8,650 White, 1,509 Black, 1,758 Hispanic and 658 Asian respondents; 2,305, 2,038, 3,488 and 5,103 respondents in the four income bands from lowest to highest; and 2,091, 3,002, 2,963 and 4,878 respondents in the four age bands from youngest to oldest.
Data: shed_groups_2024_2025.csv
- Black applicants were denied or approved for less about 2.2 times as often as White applicants in 2025 (our calculation, base n=517 and n=2,783 applicants), and the Fed reports the gap persists after it controls for income and age.
- Applicants with family income under $25,000 were denied or approved for less about 3.5 times as often as those at $100,000 or more (our calculation, base n=583 and n=1,866 applicants). For households in the lowest income band, a credit request in 2025 was more likely to fall short than to be granted in full, and one in ten adults in that band did not apply at all because they expected a denial (base n=2,305 adults).
- Adults 60 and older saw the largest one-year increase of any group (our calculation, base n=1,270 applicants in 2024 and n=1,328 in 2025), though they remain the least likely age group to be denied or approved for less.
Mortgage Application Denial Rates
This section uses HMDA records, which cover lender decisions on mortgage applications, to measure denial rates on a far larger base than either survey.
HMDA requires most mortgage lenders to report every application they act on. We calculate the denial rate as denied applications divided by all applications that reached a credit decision. Table 7 shows the national series since 2018.
| Year | All decisions (n) | All applications | Home purchase decisions (n) | Home purchase | Refinancing decisions (n) | Refinancing |
|---|---|---|---|---|---|---|
| 2018 | 10,623,751 | 24.0% | 5,196,305 | 13.0% | 1,616,951 | 27.8% |
| 2019 | 12,283,351 | 20.7% | 5,345,166 | 12.1% | 2,912,423 | 18.1% |
| 2020 | 18,184,354 | 15.9% | 5,859,387 | 12.7% | 8,095,017 | 13.3% |
| 2021 | 18,675,314 | 15.8% | 6,337,348 | 11.7% | 6,976,064 | 14.2% |
| 2022 | 11,361,613 | 22.2% | 5,296,326 | 13.5% | 1,485,997 | 22.6% |
| 2023 | 8,058,391 | 25.3% | 4,254,263 | 15.0% | 628,645 | 26.8% |
| 2024 | 8,661,779 | 24.3% | 4,319,109 | 14.4% | 975,958 | 22.9% |
| 2025 | 9,360,942 | 22.6% | 4,358,716 | 13.9% | 1,409,791 | 20.4% |
Source: Fintech Index Credit Application Rejection Rate Study (Source 1), from FFIEC HMDA Data Browser nationwide aggregations (Sources 5 and 6). Denial rates are our calculation. Refinancing excludes cash-out refinancing.
Data: hmda_denial_rates_2018_2025_our_calc.csv
- Refinancing denials fell to their lowest levels during the 2020 and 2021 refinancing boom and rose once mortgage rates climbed in 2022.
- Home purchase denials moved within a band of about three points across the full period, so most of the movement in the all-applications rate comes from other loan purposes.
- Denied applications rose to 2,115,090 in 2025 from 2,103,462 in 2024 even as the rate fell, because total decisions grew by about 8% (our calculation, base n=8,661,779 decisions in 2024 and n=9,360,942 in 2025).
HMDA also records the loan purpose and the government program behind each application. Table 8 shows 2025 denial rates by both.
| Category | Decisions (n) | Denial rate | 2024 denial rate |
|---|---|---|---|
| Home purchase | 4,358,716 | 13.9% | 14.4% |
| Refinancing | 1,409,791 | 20.4% | 22.9% |
| Cash-out refinancing | 1,449,313 | 30.1% | 32.7% |
| Home improvement | 1,020,569 | 34.8% | 37.4% |
| Other purpose | 1,117,967 | 38.1% | 42.2% |
| Conventional loan | 7,384,608 | 23.4% | 25.6% |
| FHA loan | 1,217,297 | 21.8% | 21.6% |
| VA loan | 712,168 | 16.2% | 15.3% |
| USDA loan | 46,869 | 12.9% | 12.1% |
Source: Fintech Index Credit Application Rejection Rate Study (Source 1), from FFIEC HMDA Data Browser nationwide aggregations (Sources 5 and 6). Denial rates are our calculation. Loan purpose rows exclude 4,586 decisions with no applicable purpose. 2024 bases are in the data file.
Data: hmda_denial_rates_2018_2025_our_calc.csv
- Home improvement and other-purpose applications were denied at well over twice the home-purchase rate in 2025 (our calculation, base n=1,020,569 home improvement, n=1,117,967 other-purpose and n=4,358,716 home purchase decisions). Those two purposes carry the highest denial rates in HMDA, in line with the high SHED denial rate for home equity lines. Every loan purpose had a lower denial rate in 2025 than in 2024.
- All three government loan programs posted a higher denial rate in 2025 than in 2024 while conventional loans improved.
- Conventional loans made up about 79% of 2025 decisions (our calculation, base n=9,360,942), so their rate largely sets the national figure. Changes in conventional denials move the national rate far more than changes in the FHA, VA or USDA programs.
HMDA reports applicant race and ethnicity as separate fields, and Hispanic applicants can be of any race. Table 9 shows denial rates across all loan purposes for the largest groups.
| Group | 2025 decisions (n) | 2018 | 2021 | 2023 | 2024 | 2025 |
|---|---|---|---|---|---|---|
| White | 6,076,259 | 21.7% | 14.1% | 22.9% | 21.8% | 20.2% |
| Black or African American | 771,932 | 38.0% | 26.6% | 38.7% | 36.7% | 35.5% |
| Asian | 546,697 | 25.3% | 13.8% | 22.7% | 21.3% | 20.5% |
| American Indian or Alaska Native | 67,718 | 41.7% | 27.4% | 40.8% | 37.0% | 34.9% |
| Native Hawaiian or Other Pacific Islander | 21,287 | 43.0% | 24.0% | 40.2% | 38.7% | 35.1% |
| Hispanic or Latino (any race) | 1,090,648 | 32.0% | 20.9% | 32.9% | 30.5% | 28.5% |
| Not Hispanic or Latino | 6,501,572 | 22.7% | 14.7% | 23.8% | 22.7% | 21.1% |
Source: Fintech Index Credit Application Rejection Rate Study (Source 1), from FFIEC HMDA Data Browser nationwide aggregations (Sources 5 and 6). Denial rates are our calculation. Bases for every year are in the data file.
Data: hmda_denial_rates_2018_2025_our_calc.csv
- The Black denial rate was about 1.8 times the White rate in 2025 (our calculation, base n=771,932 and n=6,076,259 decisions), a gap of 15.3 points, and the gap has ranged between about 12 and 16 points in every year since 2018 (our calculation, yearly bases in the data file).
- Every group shown had a lower denial rate in 2025 than in 2023, so the improvement since then is broad.
- Asian applicants were denied more often than White applicants in 2018 and at almost the same rate by 2025.
Denial Reasons and Credit Checks
A lender that rejects a credit application must send the applicant an adverse action notice under the Equal Credit Opportunity Act or the Fair Credit Reporting Act. The notice gives the specific reasons for the rejection, or tells the applicant of the right to learn the reasons by asking within 60 days. When the rejection rests on a credit report, the lender must also give the credit score it used, the key factors behind that score and the contact details of the credit reporting company, which must provide a free copy of the report on request within 60 days of the notice (Source 7). The score disclosure matters because rejection rates in the SCE data rise steeply as self-reported credit scores fall.
What the Rates Mean for Applicants and Lenders
A rejection rate counts only the people who applied. Some adults who expect to be turned down never apply, so a lower rate can mean that lenders approved more requests or that fewer people who expected a denial applied. Each rate also depends on who applies, so a gap between two groups or two products reflects both lender decisions and who chose to apply.
An applicant with a low credit score faces a far higher chance of rejection in the survey data, both on credit overall and on credit cards, and some applicants hold off on other credit because they expect to be turned down.
Mortgage lenders above HMDA's reporting threshold must report each application decision, so denial rates by applicant race are public. In that national data, the gaps between Black, Hispanic and American Indian applicants and White applicants have stayed open through years when overall denial rates rose and fell.
Data Collection and Methodology
Our study combines three federal data sources and recalculates every rate from the underlying files.
For the SCE Credit Access Survey, we used the New York Fed's respondent-level microdata, which run from October 2013 through June 2025, and applied the survey weights. A product rejection rate is the weighted share of applicants for that product who reported the application was rejected. Applications reported as partly granted count as not rejected. Annual rates pool every wave in the calendar year present in the microdata. The 2022 file holds the February and October waves, and the 2025 file holds the February and June waves. For the credit score comparison, we pooled the five waves from February 2024 through June 2025 and grouped respondents by their answer to the self-reported credit score question. An applicant is a respondent who applied for a card, mortgage or home-based loan, auto loan, card limit increase, other loan limit increase, mortgage refinance or student loan. "Rejected at least once" counts an applicant who was rejected on any of those seven requests. Card rejection rates in Table 5 count card applicants who reported the outcome of the card application. Our weighted product rates for June 2025 reproduce the New York Fed's published rates for cards, mortgages, auto loans, limit increases and refinancing, and our "rejected at least once" rate for that wave reproduces the published 23.1% (n=424 applicants). Wave-level figures in Table 2, including the discouraged share, come from the New York Fed's published chart data, which run through June 2026, because the microdata end in June 2025. The n shown for each wave is the published respondent count. Each wave rests on roughly 900 respondents, so wave-to-wave moves of several points are common, and the product and credit score tables pool waves for steadier estimates.
For the SHED, we used the Federal Reserve's public data files for 2020 through 2025 and the survey weights. "Denied or approved for less" is the weighted share of applicants who reported being turned down, approved for less than requested or both. "Put off applying" is the share of applicants who held off on a credit application because they thought they would be turned down. "Did not apply, expected denial" is the share of all adults who wanted credit, did not apply and gave that reason. Race and ethnicity follow the SHED five-category variable, in which White, Black and Asian exclude Hispanic respondents. The "Other" category is held out of Table 6 because of its small base and is kept in the data file. Income uses the four-band family income variable, and age uses the four-band age variable. Product rates use the product questions asked since 2022. The "other credit or loan" product is excluded. Our 2025 overall and racial figures reproduce the rounded values in the Federal Reserve's published report.
For HMDA, we pulled nationwide aggregations for 2018 through 2025 from the FFIEC Data Browser API, split by action taken and by one of loan purpose, loan type, derived race or derived ethnicity. The denial rate is denied applications divided by the sum of originated loans, applications approved but not accepted and denied applications. Withdrawn applications, incomplete files, purchased loans and preapproval requests (action codes 7 and 8) are excluded. Counts are applications, and one borrower can file more than one. The API allows two filters per request, so race and ethnicity rates cover all loan purposes. "Joint" and "not available" race and ethnicity records stay in the totals and are left out of the group comparisons.
All SCE and SHED n values are unweighted respondent counts. Rates are rounded half up to one decimal place. Ratios and point gaps are computed from rates at full precision and labeled as our calculation.
Sources
- Fintech Index, Credit Application Rejection Rate Study: analysis of New York Fed Survey of Consumer Expectations Credit Access Survey microdata and chart data (October 2013 to June 2026), Federal Reserve Survey of Household Economics and Decisionmaking public data (2020 to 2025) and HMDA nationwide mortgage decision records (2018 to 2025), conducted October 2026
- Federal Reserve Bank of New York, SCE Credit Access Survey
- Board of Governors of the Federal Reserve System, Survey of Household Economics and Decisionmaking data
- Board of Governors of the Federal Reserve System, Economic Well-Being of U.S. Households in 2025, May 2026
- Federal Financial Institutions Examination Council, HMDA Data Browser
- Federal Financial Institutions Examination Council, HMDA Data Browser API documentation
- Consumer Financial Protection Bureau, What can I do if my credit application was denied because of my credit report?