Bank Branch Closure Statistics: 2026 Report

A bank office is a place where an insured bank or savings institution serves customers, from a main office on a town square to a branch inside a supermarket. The number of these offices rose for 15 years, peaked in 2009, and has fallen every year since. The decline has slowed, but it has not been even across bank sizes or counties, so we looked at where offices remain.
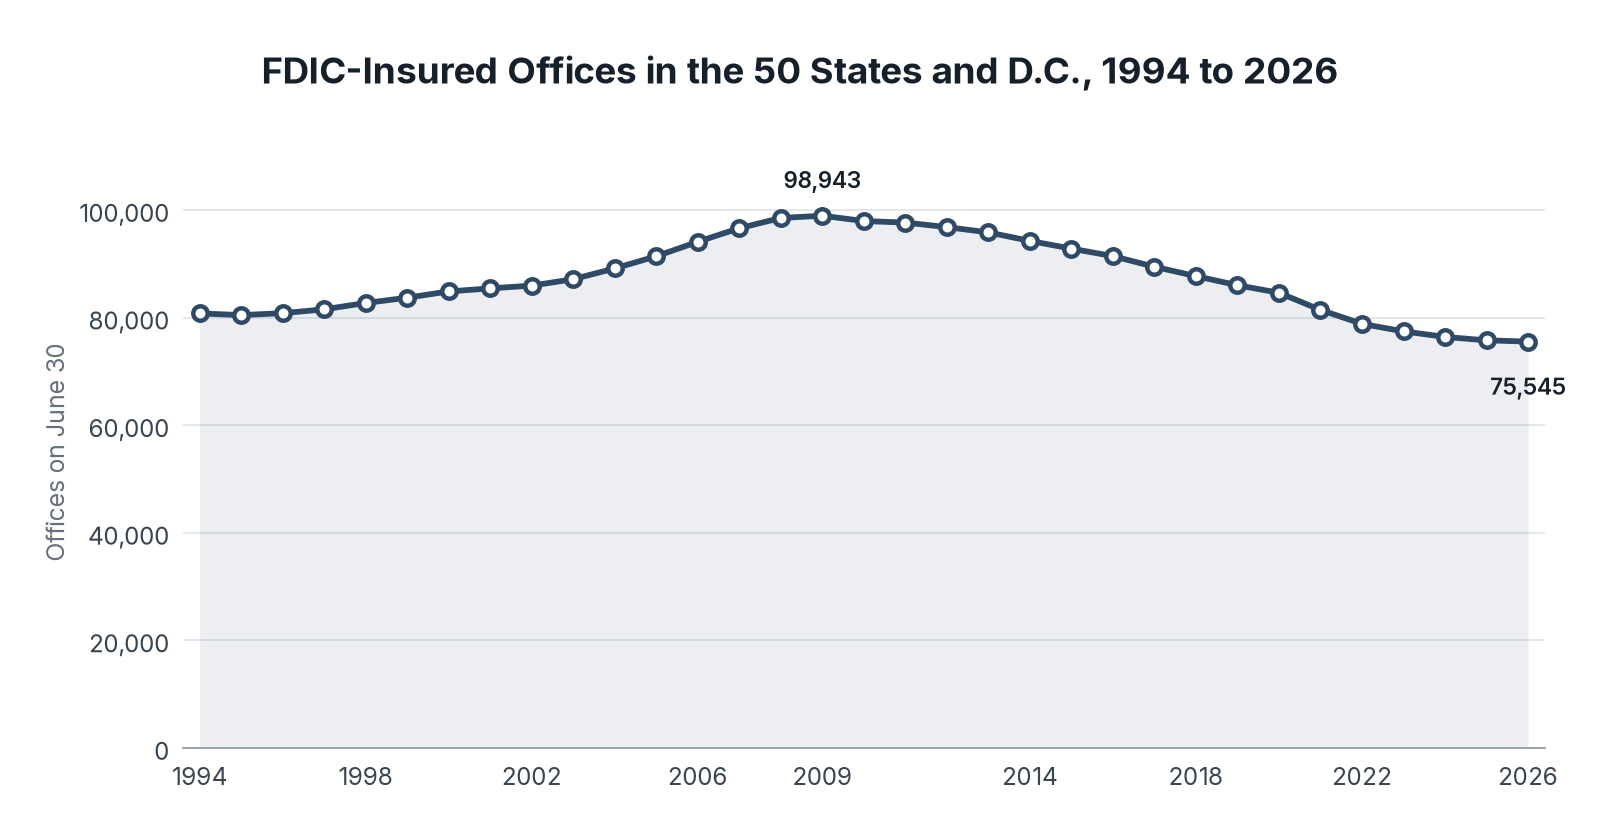
Our analysts counted every office in the FDIC's Summary of Deposits from 1994 through June 30, 2026, limited to the 50 states and the District of Columbia, and compared those counts by the bank's assets and by county, using Census Bureau 2024 county-equivalent geographies, as of Q4 2026. The office count fell by 236 in the year to June 30, 2026, to 75,545, the smallest decline since the 2009 peak.
In the following sections, we compare the long-run office count, the change by bank size, and the number of counties with one office or none.
Key Findings
- Banks and savings institutions operated 75,545 offices in the 50 states and D.C. as of June 30, 2026, down 236 from a year earlier and down 23,398, or 23.6%, from the 2009 peak of 98,943.
- Banks with $100 billion or more in assets added 1,192 offices in the year to June 30, 2026. Banks under $10 billion accounted for the entire national decline, and more.
- 188 counties, or 6.0% of the 3,144 county-equivalents in the 50 states and D.C., had one bank office or none. Texas, Montana, Georgia, and Alaska had the most of these counties.
- The figures count offices of FDIC-insured banks and savings institutions. They do not include credit union branches, and a year-to-year change is a net change in the office stock, not a count of openings or closings.
The Decline Has Slowed After a Steep Mid-Decade Drop
The office count rose from 80,788 in 1994 to a peak of 98,943 in 2009. It has fallen in every year since. The sharpest drop was in 2021, when the count fell by 3,179, to 81,439. The declines have been smaller in each year since 2022. The 236-office drop in 2026 was the smallest since the peak, smaller even than the 285-office decline in 2011.
These are net changes in the number of offices on the last business day of June. A bank can close one office and open another in the same year, and both would be hidden in the net figure. The count also includes offices that are not traditional brick-and-mortar branches. Of the 75,545 offices in 2026, 70,763 were full-service brick-and-mortar offices.
| Year | Offices |
|---|---|
| 1994 | 80,788 |
| 2000 | 84,871 |
| 2009 | 98,943 |
| 2015 | 92,825 |
| 2019 | 86,027 |
| 2021 | 81,439 |
| 2025 | 75,781 |
| 2026 | 75,545 |
Key Findings
- The 2021 decline of 3,179 offices remains the largest annual drop in the 33-year series.
- From the 2009 peak through 2026, the office count fell by 23,398, or 23.6%.
- Including U.S. territories, the 2026 total was 75,859, of which 314 offices were outside the 50 states and D.C.
Large Banks Added Offices. Smaller Banks Did Not.
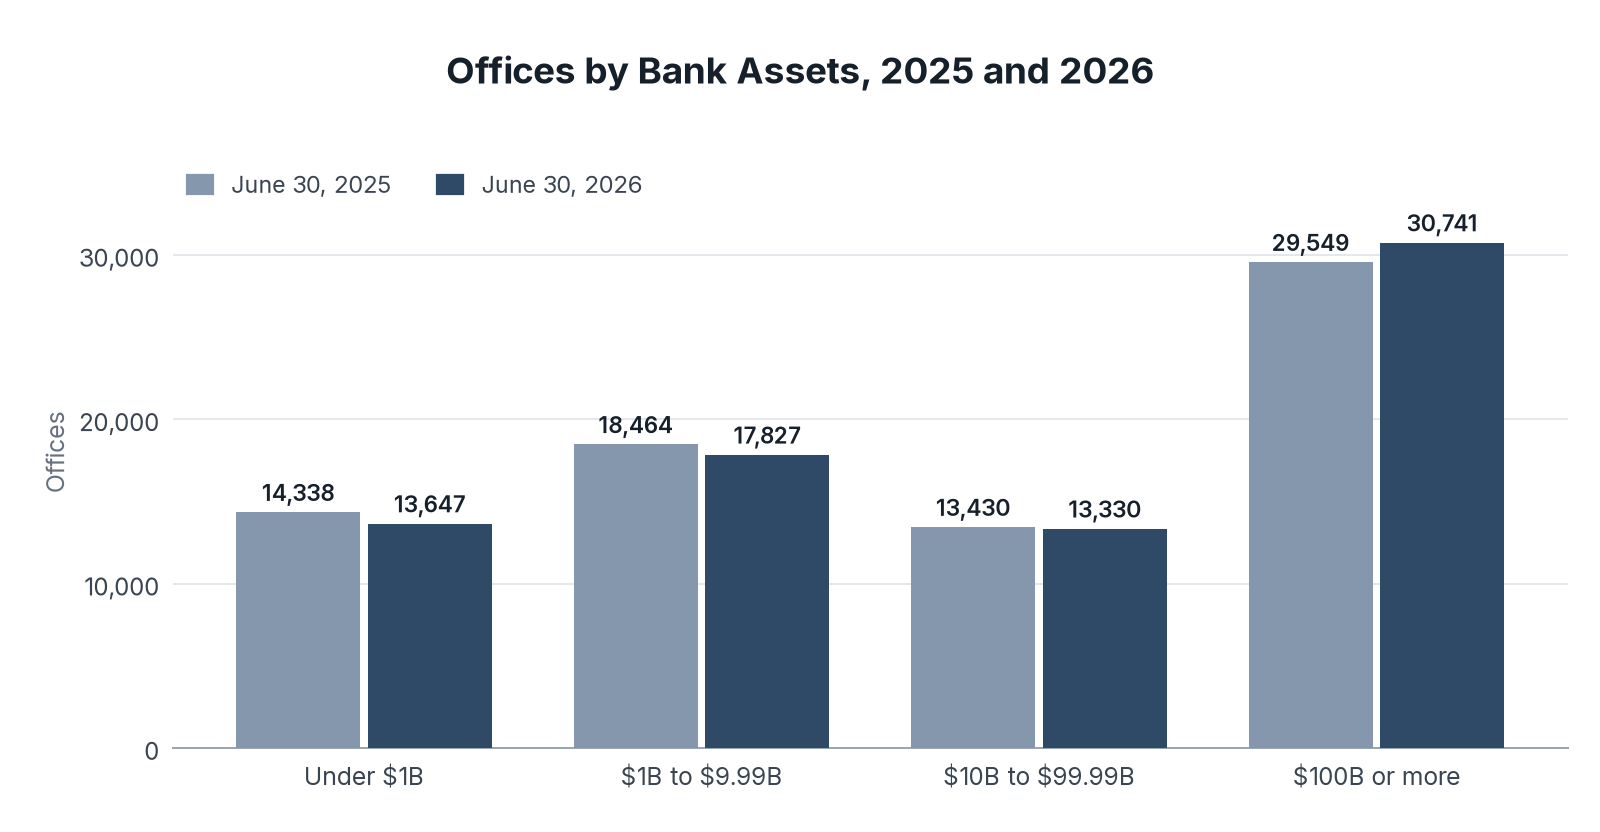
We grouped every office by the assets of the bank that owned it. Banks with $100 billion or more in assets held 30,741 offices in 2026, up 1,192 from 2025. Banks under $1 billion held 13,647 offices, down 691. Banks with $1 billion to $9.99 billion held 17,827, down 637. The $10 billion to $99.99 billion group was nearly flat, at 13,330, down 100.
That 1,192-office increase in the largest group is not a count of new branches. One bank, Pinnacle Bank, crossed the $100 billion line in 2026 after its assets rose from $54.7 billion to $128.8 billion and its office count rose from 145 to 389. Among the 31 banks that were already in the $100 billion group in 2025, the office count rose by 803, to 30,352. In every size group, banks that stayed in the same group from 2025 to 2026 added offices. The national decline of 236 offices comes from banks that left the file, often through mergers, and from banks that moved from one size group to another.
The number of institutions also fell, from 4,425 in 2025 to 4,243 in 2026. 190 institutions that appeared in 2025 were gone in 2026, and they had operated 2,533 offices. Eight institutions appeared for the first time in 2026, with 12 offices.
| Asset size | Institutions, 2025 | Offices, 2025 | Institutions, 2026 | Offices, 2026 | Office change |
|---|---|---|---|---|---|
| Under $1 billion | 3,375 | 14,338 | 3,189 | 13,647 | -691 |
| $1 billion to $9.99 billion | 895 | 18,464 | 894 | 17,827 | -637 |
| $10 billion to $99.99 billion | 124 | 13,430 | 128 | 13,330 | -100 |
| $100 billion or more | 31 | 29,549 | 32 | 30,741 | 1,192 |
Key Findings
- Banks with $100 billion or more in assets held 40.7% of offices in 2026, up from 39.0% in 2025.
- Banks under $10 billion accounted for a combined decline of 1,328 offices, more than the national net decline of 236.
- The number of banks under $1 billion fell by 186, to 3,189.
Most Counties Still Have Several Bank Offices. A Small Share Have One or None.
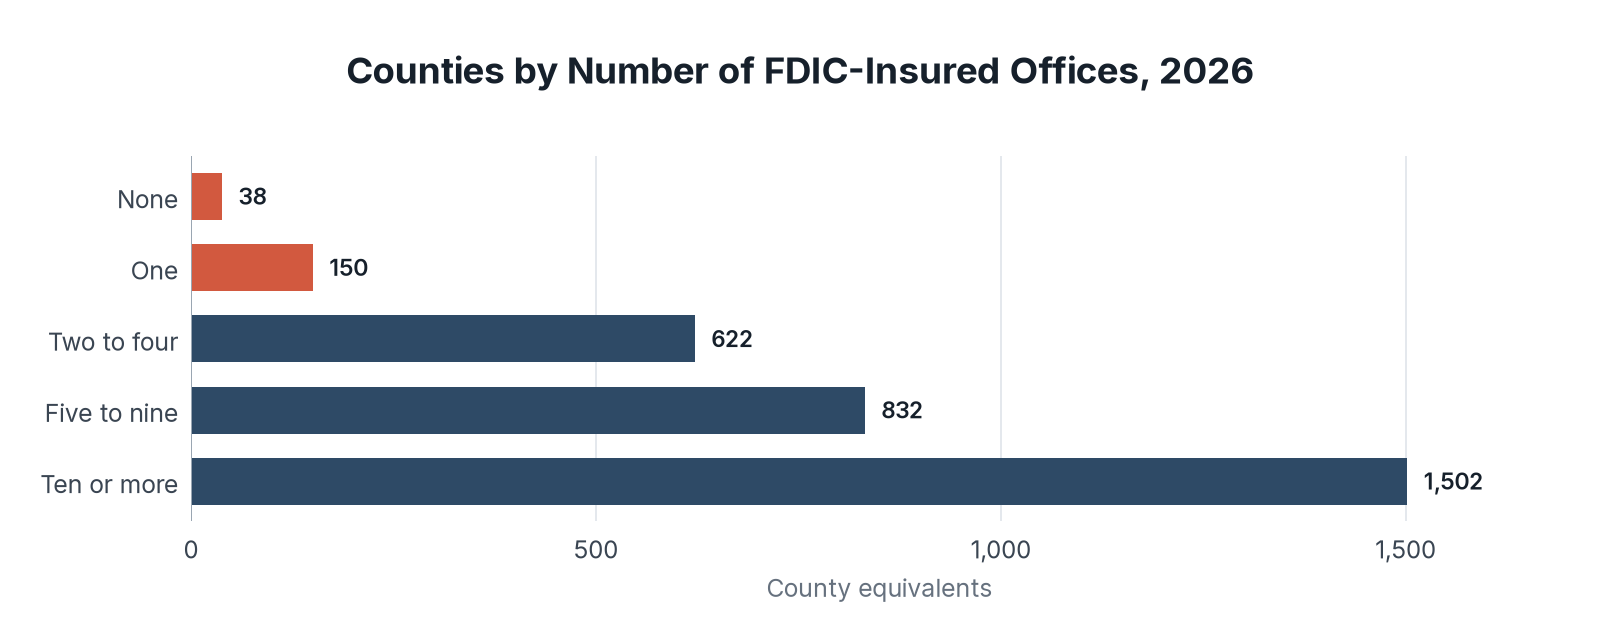
We assigned every 2026 office to a county-equivalent using Census Bureau geographic codes from 2024, a vintage that covers 3,144 counties, parishes, boroughs, independent cities, and, in Connecticut, planning regions. 1,502 of those counties, just under half, had 10 or more bank offices, and they held 67,885 offices. 832 counties had five to nine offices, and 622 had two to four.
At the other end, 150 counties had a single bank office, and 38 had none. Together, those 188 counties are 6.0% of the county-equivalents in the 50 states and D.C. Texas had 26 such counties, the most of any state, followed by Montana with 17, Georgia with 16, and Alaska with 14. Credit union branches are not in this file, so a county with no bank office may still have a credit union.
Two 2026 offices still carry retired Connecticut county codes that the Census Bureau no longer uses as county-equivalents. They are included in the national office total of 75,545 and are omitted from the county counts, which sum to 75,543 offices.
| Number of bank offices | Counties | Offices in those counties |
|---|---|---|
| None | 38 | 0 |
| One | 150 | 150 |
| Two to four | 622 | 1,853 |
| Five to nine | 832 | 5,655 |
| Ten or more | 1,502 | 67,885 |
Key Findings
- Counties with 10 or more bank offices held 89.9% of the offices that could be matched to a current county-equivalent.
- 38 counties had no FDIC-insured bank office in June 2026.
- A county with one office or none is not necessarily without any place to bank, because credit unions are outside this count.
What This Means for People Who Still Use a Branch
The branch is not disappearing on a national scale at the pace it was five years ago. The 2026 decline was the smallest in 17 years. What is changing is who owns the offices that remain, and how thinly they are spread in some counties. Larger banks now hold a greater share of the office stock. Smaller banks, which often serve the counties with few offices, account for the net losses.
A county with one bank office, or none, is a different place to be a customer than a county with ten. The distance to cash a check, open an account, or sit with a lender can be long, and a closure there removes the only bank office in the county. These figures cannot tell you which office will close next, and they leave out credit unions, but they do show where the bank office network is already thin.
So if you still rely on a nearby branch, it is worth knowing whether your county has several offices or only one, because the national slowdown in closures does not change the math in a county that is already down to a single bank.
Data Collection and Methodology
We reviewed sources available in Q4 2026. The office counts come from the FDIC's Summary of Deposits, an annual stock of every office of an FDIC-insured bank or savings institution as of June 30. We limited the national series to offices in the 50 states and the District of Columbia, identified by the office state code. Offices in U.S. territories are excluded from the main totals and are noted separately. The year-to-year change is the change in that stock, not a count of openings or closings. Asset-size groups use the institution's total assets, reported in thousands of dollars in the Summary of Deposits, as of the same June 30 date. County figures use Census Bureau vintage 2024 county-equivalent codes, which include 3,144 counties, parishes, boroughs, independent cities, and Connecticut planning regions in the 50 states and D.C. Two 2026 offices still carry retired Connecticut county codes (FIPS 09001 and 09009) and are omitted from the county tables. Credit union branches are not included. Service-type counts use the FDIC's office service-type code. Brick-and-mortar full-service offices are service type 11. Full-service offices more broadly are types 11 through 16.
Sources
- Fintech Index, Bank Branch Closure Study: analysis of FDIC Summary of Deposits office counts from 1994 through June 30, 2026, by bank asset size and by county, conducted November 2026.
- Federal Deposit Insurance Corporation, Summary of Deposits, June 30, 1994 through June 30, 2026
- Federal Deposit Insurance Corporation, Summary of Deposits API
- Federal Deposit Insurance Corporation, FDIC Releases Results of Summary of Deposits Annual Survey, September 18, 2026
- U.S. Census Bureau, Vintage 2024 Geographic Codes
- Table 1: Source: FDIC Summary of Deposits, June 30 of each year, 50 states and the District of Columbia. Data: fdic_sod_office_counts_1994_2026.csv
- Chart 1: Source: FDIC Summary of Deposits, June 30 of each year, 50 states and the District of Columbia.
- Table 2: Source: FDIC Summary of Deposits, June 30, 2025 and 2026, 50 states and the District of Columbia. Assets are as of the same date. Data: fdic_sod_offices_by_bank_asset_size_2025_2026.csv
- Chart 2: Source: FDIC Summary of Deposits, June 30, 2025 and 2026, 50 states and the District of Columbia. Assets are as of the same date.
- Table 3: Source: Fintech Index analysis of the FDIC Summary of Deposits, June 30, 2026, and Census Bureau vintage 2024 county-equivalent geographies. Data: fdic_sod_counties_by_office_count_2026.csv
- Chart 3: Source: Fintech Index analysis of the FDIC Summary of Deposits, June 30, 2026, and Census Bureau vintage 2024 county-equivalent geographies.