AML False Positive Rate Statistics: 2026 Report

Our analysts reviewed published customer results from the AML vendors we rate, FinCEN's annual filing statistics, and Unit21's data on AI alert review, as of Q4 2026. We compared reported false-positive reductions, tracked suspicious activity report volumes by fiscal year, and measured how often AI closes alerts without a person.
Vendor case studies describe one customer each and use different measures, so every row keeps its own metric.
Key Findings
- Published customer results at rated AML vendors show false-positive or alert-volume cuts from about 50% to more than 90%, and Banco do Brasil's screening false-positive rate fell to 2% after its Napier AI rollout.
- US filers submitted 4.8 million suspicious activity reports in FY2025, up about 12% from 4.3 million in FY2022.
- Depository institutions filed about 58% of FY2025 SARs and money services businesses about 26%.
- In Unit21's data on more than one million AI-worked alerts, AI closed only about 0.5% on its own, while assist mode made up about 84% of usage.
Rated Vendors Report False-Positive Cuts of 50% to More Than 90%
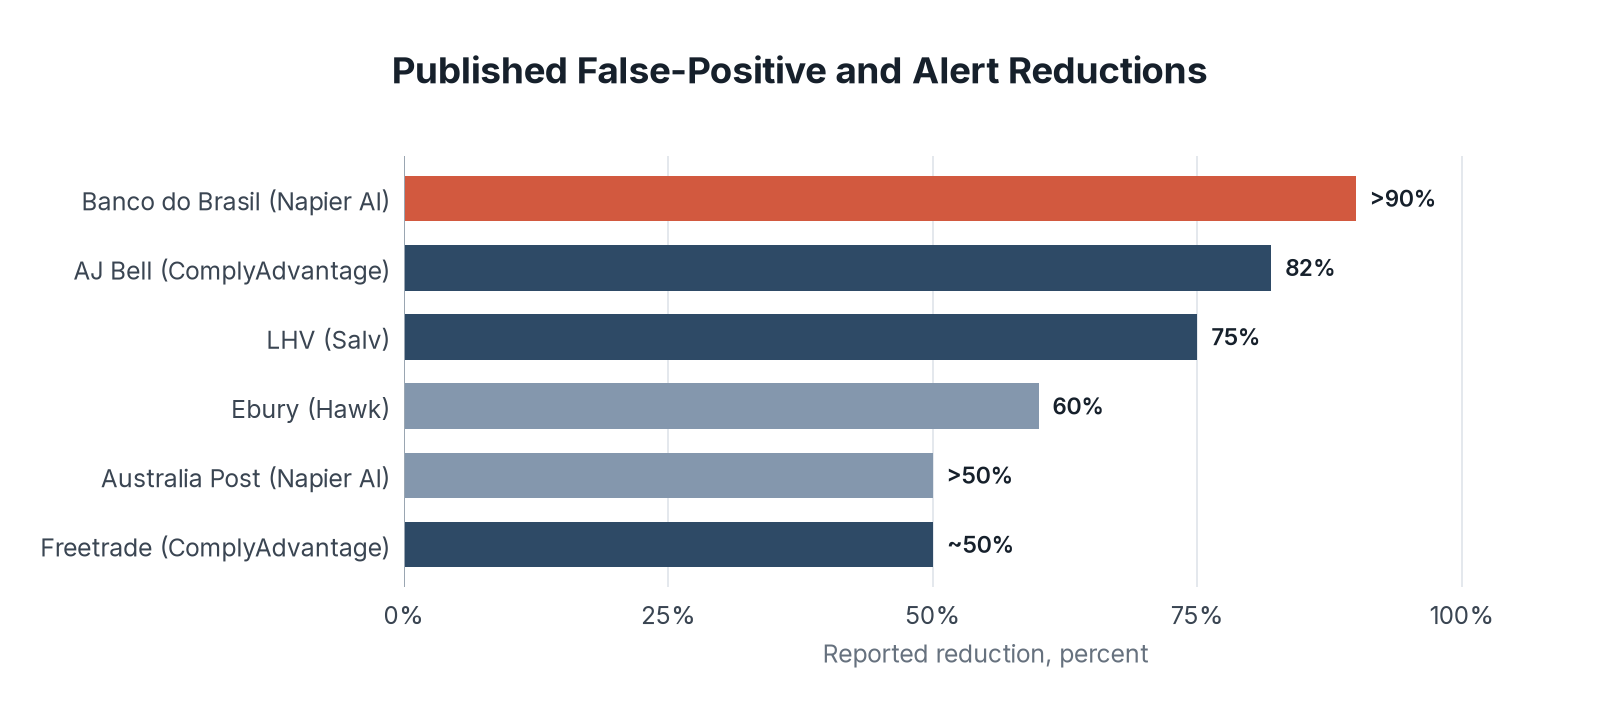
We collected the customer results that rated AML vendors publish on their own sites. Each case covers one customer, and vendors choose which results to publish, so the rows show what a well-run project can reach, not an industry average.
| Vendor | Customer | Use case | Reported reduction | Metric |
|---|---|---|---|---|
| Napier AI | Banco do Brasil | Transaction screening | More than 90% | False-positive hits; false-positive rate down to 2% |
| ComplyAdvantage | AJ Bell | Customer screening | 82% | Alert volume |
| Salv | LHV | Screening | 75% | Manually reviewed transactions, from 1% to 0.25% |
| Hawk | Ebury | Transaction monitoring | 60% | False positives after model retraining; 46% at launch |
| Napier AI | Australia Post | Transaction monitoring | More than 50% | False positives |
| ComplyAdvantage | Freetrade | Ongoing customer screening | About 50% | False positives |
Key Findings
- Screening projects report the largest cuts, led by Banco do Brasil at more than 90% and AJ Bell at 82%. Fuzzy matching against sanctions and PEP lists creates many near-identical hits, so better matching has more to remove.
- Transaction monitoring results cluster lower in this set, at 50% to 60%. Ebury nearly doubled the share of actionable alerts, from 14% to 30%, which still leaves 70% of its alerts without action.
- LHV's cut from 1% to 0.25% of transactions sent to manual review let a single agent handle more than 13,000 alerts a month.
US SAR Filings Rose to 4.8 Million in FY2025
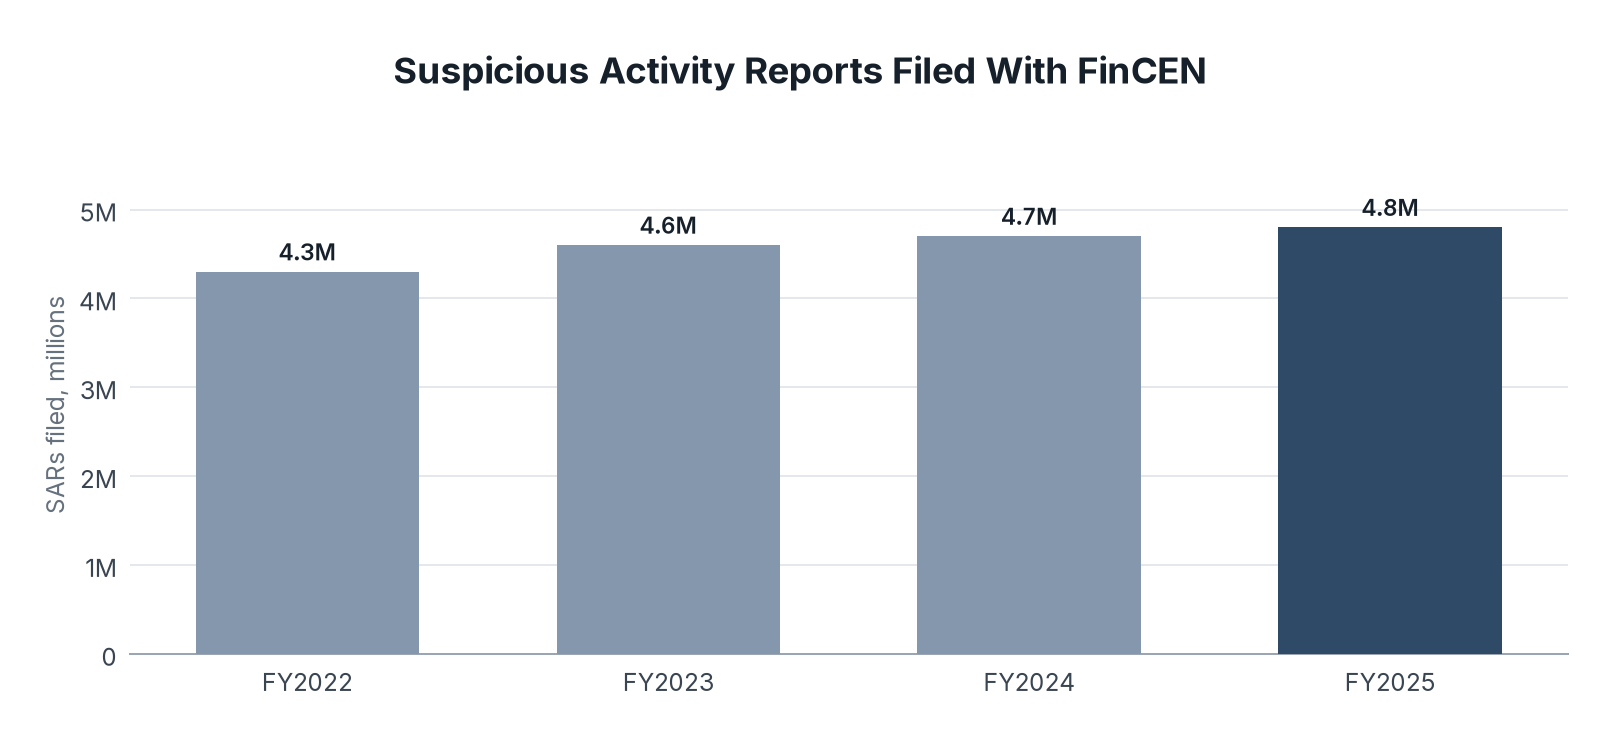
FinCEN publishes the number of Bank Secrecy Act reports filed each fiscal year. A suspicious activity report is the end point of an alert that survives review, so SAR volume shows how much monitoring output reaches the regulator.
| Fiscal year | SARs filed | Change from prior year |
|---|---|---|
| FY2022 | 4.3 million | Base year |
| FY2023 | 4.6 million | +7.0% |
| FY2024 | 4.7 million | +2.2% |
| FY2025 | 4.8 million | +2.1% |
Key Findings
- SAR volume grew about 12% from FY2022 to FY2025, and most of that growth came in FY2023. Annual growth has held near 2% since then.
- Depository institutions filed 2.8 million SARs in FY2025 and money services businesses 1.26 million. Securities and futures firms filed about 102,000, casinos about 77,000, and loan or finance companies about 44,000.
- About 335,000 registered institutions and other filers submit BSA reports, an average of about 14 SARs per filer in FY2025 that hides wide differences between large and small filers.
AI Closes About 0.5% of Alerts on Its Own
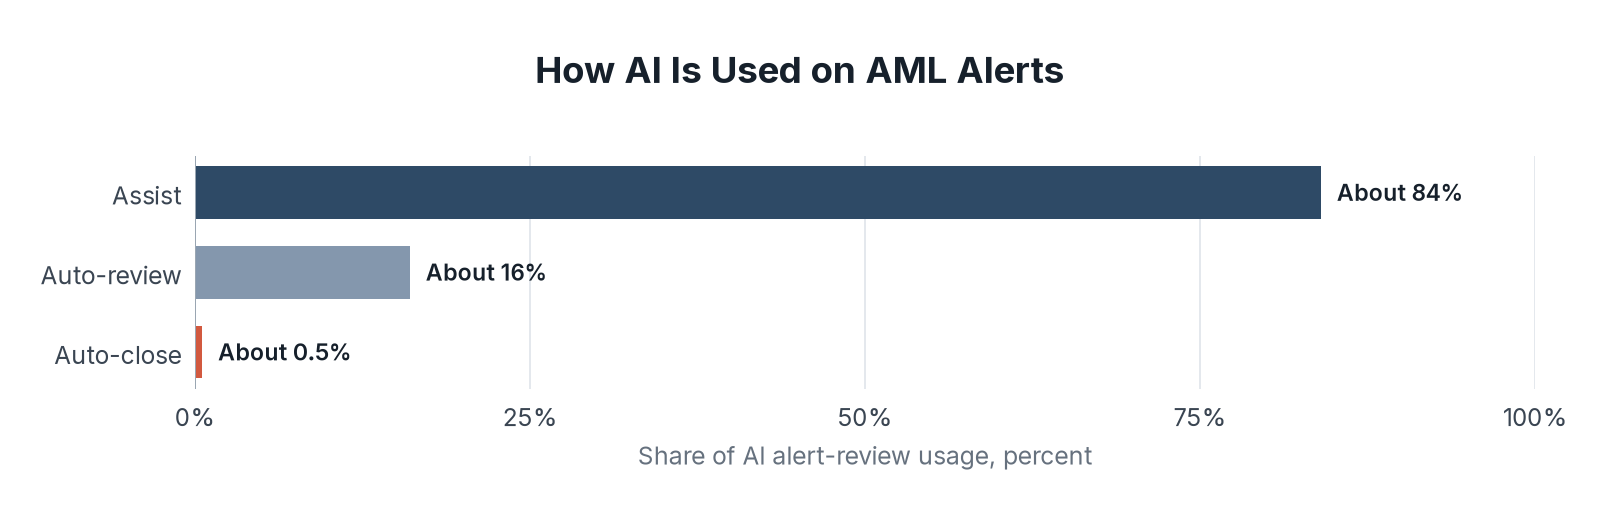
Unit21 published usage data from about a year of live AI alert reviews, covering more than one million alerts across its customers. It splits AI use into three levels, from research support to fully automatic closing.
| Level | What the AI does | Share of AI usage |
|---|---|---|
| Assist | Researches the alert; an analyst decides | About 84% |
| Auto-review | Recommends a decision for a human to approve | About 16% |
| Auto-close | Closes the alert on its own | About 0.5% |
Key Findings
- Most teams keep a person in the decision. Assist mode accounts for about 84% of AI usage and auto-close for about half a percent.
- AI-worked alerts found true positives about twice as often as human-only alerts overall, about 15 times as often in fraud workflows, and about 7 times as often in enhanced customer review (EDD) cases.
- One organization's simple check-deposit threshold ran at a false-positive rate of about 99%, the kind of queue where analyst fatigue leads to missed fraud.
False Positives Still Dominate AML Alert Queues
False positives remain the largest cost in AML operations. Published vendor results show that tuning and AI can remove half or more of them, while SAR filings keep rising by about 2% a year, so alert queues are not getting smaller on their own.
Looking ahead, the share of alerts that AI closes without a person should rise from today's half a percent as examiners grow comfortable with agent decisions and audit trails. FinCEN's work to modernize the AML regime could also change which activity institutions must report.
So if you run an AML alert queue, measure your own false-positive rate and true-positive yield first, then ask each vendor to repeat its published result on a sample of your data.
Data Collection and Methodology
We reviewed sources available in Q4 2026. Each vendor row keeps the metric and customer stated in the case study. Where a case study gives a floor, such as more than 90%, the chart plots the floor. Salv's LHV reduction is calculated from the share of transactions sent to manual review: (1% minus 0.25%) divided by 1% equals 75%. Hawk's Ebury result uses the 60% figure after model retraining; the 46% launch figure is shown in the metric column.
SAR changes are calculated from FinCEN's rounded counts: 4.6 divided by 4.3 is +7.0%, 4.7 divided by 4.6 is +2.2%, 4.8 divided by 4.7 is +2.1%, and 4.8 divided by 4.3 is +11.6%, shown as about 12%. Shares by institution type use the sum of FinCEN's FY2025 type counts, 4.839 million: depository institutions 2.8 million (57.9%) and money services businesses 1.26 million (26.0%). SARs per filer: 4.8 million divided by 335,000 is 14.3.
Unit21's level shares are rounded by the company and total 100.5%. Every figure in this report is a count or a percentage, so no currency conversion and no Federal Reserve H.10 exchange rate was needed.
Sources
- The Fintech Index analysis of rated companies, Q4 2026
- Napier AI, Banco do Brasil case study
- Napier AI, Australia Post case study
- ComplyAdvantage, AJ Bell customer story
- ComplyAdvantage, Freetrade customer story
- Salv, LHV screening case study
- Hawk, Ebury case study
- FinCEN Year in Review for FY 2025
- Unit21, What 1M live AI alerts tell us about how fincrime teams adopt AI
- Table 1: Source: The Fintech Index analysis of customer case studies published by Napier AI, ComplyAdvantage, Salv, and Hawk. Data: aml_false_positive_reductions.csv
- Chart 1: Source: The Fintech Index analysis of customer case studies published by Napier AI, ComplyAdvantage, Salv, and Hawk.
- Table 2: Source: FinCEN Year in Review for FY 2025. Data: aml_sar_filings.csv
- Chart 2: Source: FinCEN Year in Review for FY 2025.
- Table 3: Source: Unit21, What 1M live AI alerts tell us about how fincrime teams adopt AI, November 2026. Data: aml_ai_review_levels.csv
- Chart 3: Source: Unit21, What 1M live AI alerts tell us about how fincrime teams adopt AI, November 2026.